 By
By Using Coiled with Anvil
If you’ve got some big datasets and you want to wrangle some insights from them, you might want to distribute all that heavy-duty computation. Coiled lets you do just that, and takes the hosting off your plate too. So, of course, I built an app to showcase just how easy it is to use Coiled with Anvil. Today’s blog post is a tour of that app and how it works, and it aims to give readers a good idea of how they might extend the app to meet their own needs.
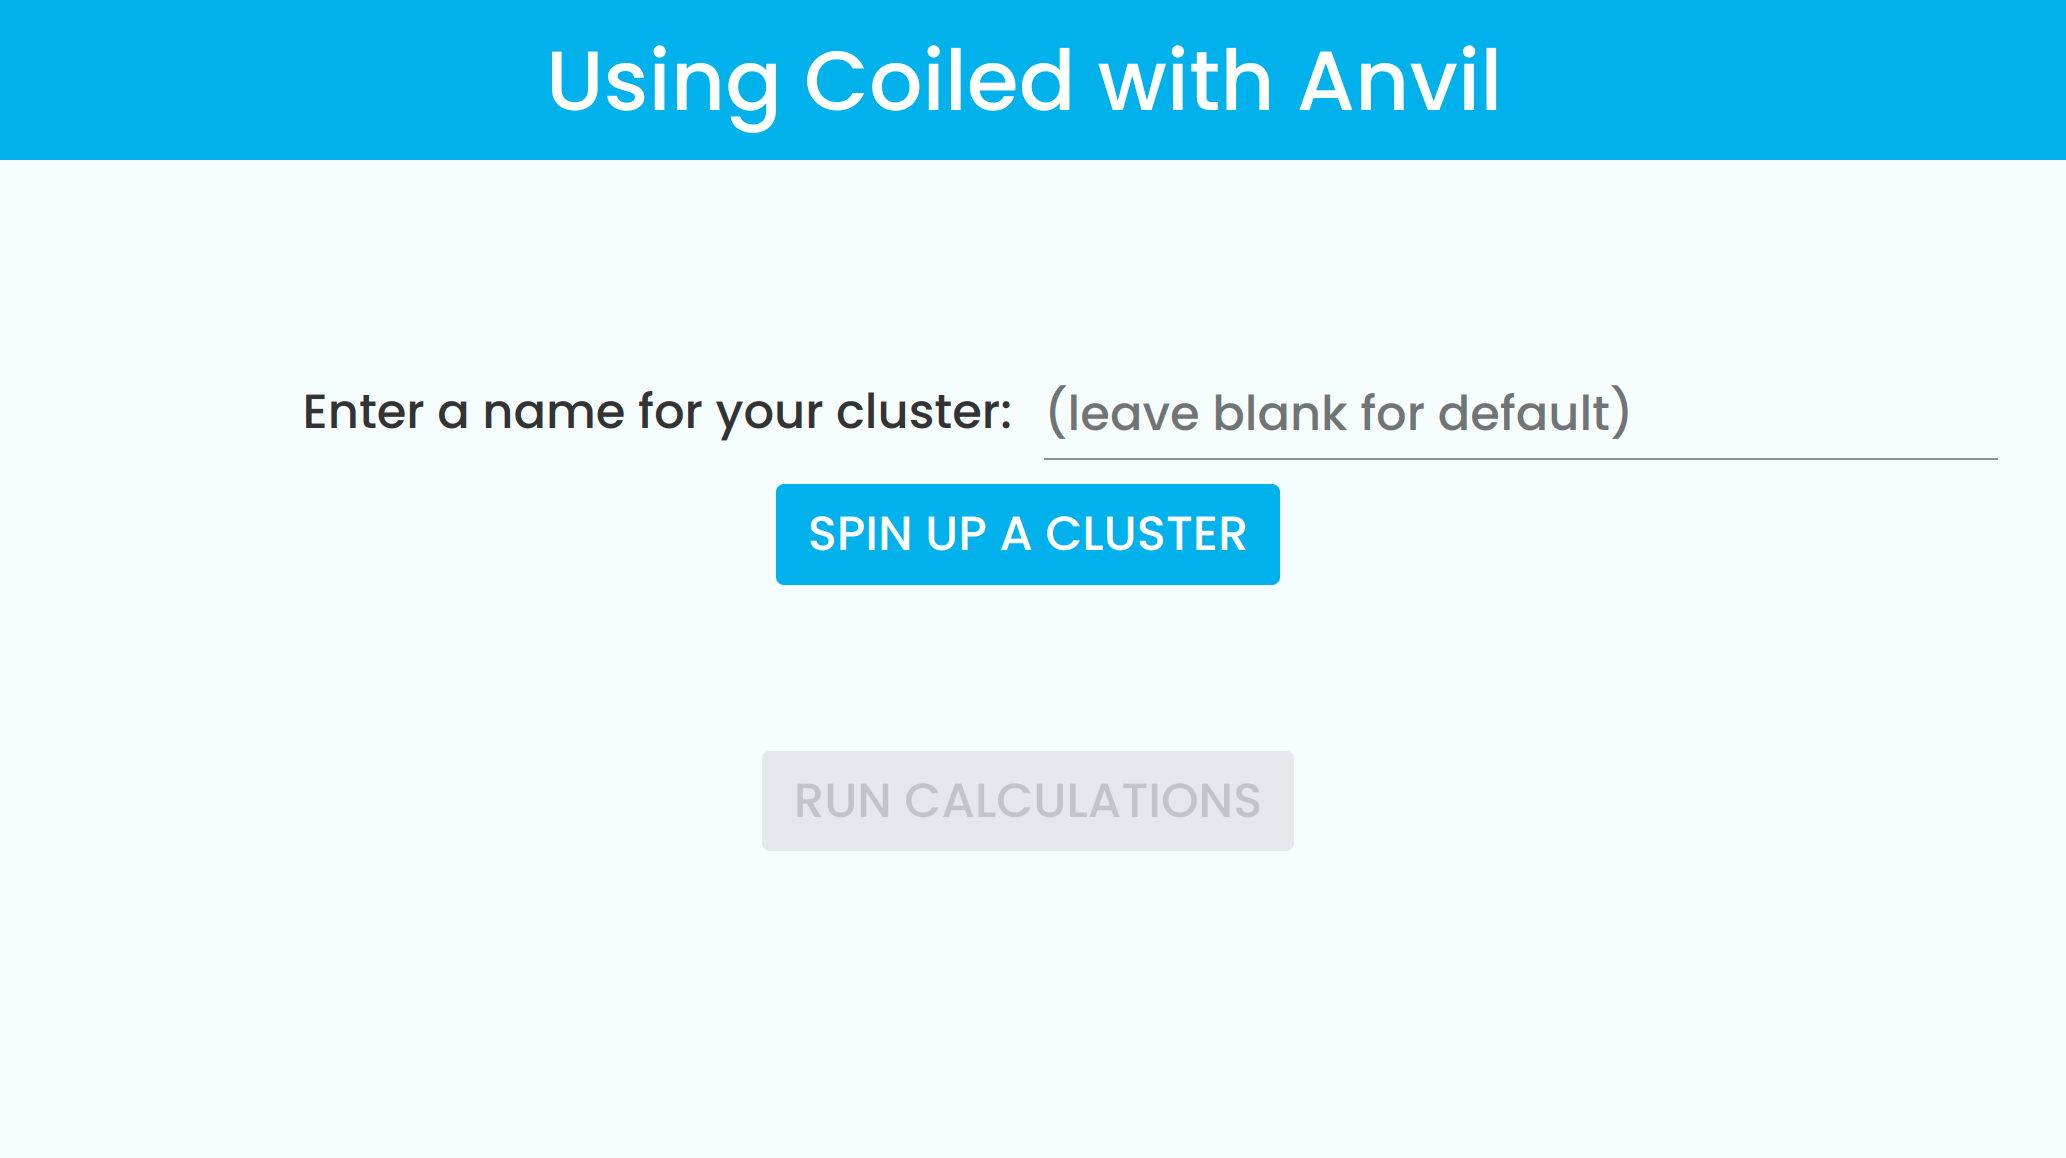
Here’s what the finished app looks like when it’s first loaded. Later, it’ll display output data.
This example app uses Coiled to do some computation on a randomly generated Dask timeseries dataset, then generates Plotly plots from that output data to display to the user.
It also shows how to use Anvil’s PDF generation to provide a PDF version of that output, for the user to download.
By the end, you’ll know how to use Coiled with Anvil, and be able to build an app of your own!
Read on to learn more about the following:
- Coiled, Anvil, and using the two together
- Configuring your Anvil server environment for Coiled
- Using Background Tasks
- Wrangling some data!
- Building a UI
- Plotting our output data
- Generating PDF output
You can also clone the app to read the code and follow along:
Let’s dive in!
What is Coiled?
Coiled provides a platform for users to spin up clusters for for distributed computation using the popular Python framework, Dask.
All you have to do is to use it is create an account and link that up an existing AWS or GCP account (so that Coiled knows where to create your clusters!). From there, it’s all Python.
For the purposes of this blog post, I’ll be assuming a basic familiarity with Coiled, but all you really need to know is that Coiled is a fast and easy way to do some serious computation - without needing access to any powerful computers yourself. You can see some great examples of Coiled usage on their blog.
What is Anvil?
Anvil is a platform for building web applications using nothing but Python, which means we need to know a little about the web. In particular, web apps have front-end code, also called client code, (which runs in the user’s browser) and back-end code (which runs on a server somewhere). Anvil lets you write both front-end and back-end code in Python, and communicate by calling back-end functions from front-end code.
Anvil also has a drag-and-drop Editor for building user interfaces, which we’ll be using later in this walkthrough.
How can we use the two together?
You can install any custom package you like into your Anvil apps’ server environments, so we’ll be driving Coiled from back end code.
Coiled is typically used in notebooks such as Jupyter notebooks, or Google Colab notebooks. Anvil’s server environments differ slightly from these environments in a couple of ways that are important here:
- When client code in an Anvil app makes a call to the server, the server environment is created anew each time (unless you’re using the Persistent Server for your Anvil app)
- Normal server calls on Anvil apps have a time-out of 30 seconds, meaning that long-running tasks (such as running a Coiled computation) need to be run as Anvil Background Tasks.
The first point means that we need to make sure that all the necessary configuration to connect to Coiled is in place every time the server environment loads.
The second point means that for any long-running function calls, we’ll be using Anvil’s Background Tasks, which are specifically designed to handle situations where a call will take a while to complete.
With these two things in mind, we’re ready to get building. Since Coiled is a Python package, we can install it into any Anvil app with access to custom packages, and we’re off!
Configuring your Anvil app’s server environment
Whenever our server environment loads, we’ll need it to be correctly configured so that it can connect to Coiled. To do this, we can set the details we need from code using dask.config.set, like this:
dask.config.set({
  "coiled.user": "my-coiled-username",
  "coiled.server": "https://cloud.coiled.io"
})
Adding a dask.config.set call at the top of our Server Module will ensure that any code that runs in our server environment will be doing so with this configuration in place.
For this example app, we’ll be configuring the following:
- The name of the Coiled account it should connect to
- The name of the specific user within that Coiled account
- An API token associated with this user
- The server that should be used to provison clusters
More information on how to find each of these pieces information can be found in the Coiled documentation.
config.yaml file to configure your Coiled environment. You could use the approach detailed in this blog post to set any of the options you’d typically set in a YAML configuration file.The account name, username and server aren’t secret, but the API token should be stored securely. To do this, we’ll use Anvil’s App Secrets so that the token is encrypted at rest, and leave the other configuration details hard-coded.
That means that we can write a function to configure our Python environment to use Coiled correctly, and that code looks this:
import dask
dask.config.set({
  "coiled.token": anvil.secrets.get_secret('coiled_token'), # get the API token
  "coiled.user": "eli-holderness", # that's me!
  "coiled.account": "eli-holderness",
  "coiled.server": "https://cloud.coiled.io",
})
Putting this code at the top of our Server Module means that it’ll always run before anything else, which is exactly the behaviour we want.
Using Background Tasks
When we actually use Coiled, we’ll be doing it from inside a Background Task, so that our code has the time it needs to run. These tasks are written in our app’s server code, and we’ll define two Background Task functions there - one for spinning up a new cluster, and one for doing all the computation.
For example, here’s the code for spinning up a new cluster from a Background Task:
DEFAULT_CLUSTER_NAME = "anvil-coiled-demo"

...

@anvil.server.background_task
def setup_cluster(name):
  setup_config()
  cluster = coiled.Cluster(
    name=name if name else DEFAULT_CLUSTER_NAME,
    n_workers=1,
    scheduler_options={"idle_timeout": "1 hour"},
    shutdown_on_close=False,
  )
We can see that it takes a name variable as input. When we build our UI, we’ll provide a way for the app’s user to choose a name for the new cluster, with a default option hard-coded within the Server Module.
The way to launch a Background Task is from another server function:
@anvil.server.callable
def start_cluster(name):
  task = anvil.server.launch_background_task('setup_cluster', name)
  return task
We can see that when the Background Task is launched, a task variable is returned, which provides the mechanism for callbacks to the task. From within that task’s function, we can write to the task’s state (a dict-like object) with anvil.server.task_state['key'] = value, and from outside the function we can read that state by calling task.get_state(). For more detail, see Communicating with Background Tasks.
Later, we’ll be using task.get_state() to retrieve the results of our computation, and task.is_completed() (which returns True if the function has finished, and False otherwise) to check on the status of our long-running tasks from client code.
Building a UI
Next, we’re going to build the UI for our app, all in Python, with Anvil’s visual UI editor. With the Editor, you can drag and drop visual components onto your app, and then interact with these components using client-side Python code. The pages for your app are called Forms, and the app we’re going to build will have two Forms - a StartupForm and a ResultsForm.
The app we’re building today is actually very simple. It spins up a cluster, connects to that cluster to do some basic computation, then displays the outputs.
So, we’re going to build the following:
- one Form (the
StartupForm) that lets the user choose a name for their new cluster and spin it up, then run the computation - one Form (the
ResultsForm) that displays the results of that computation
The StartupForm has a few components: A TextBox that asks for a name for the new cluster, two Buttons, and some Label elements that display text, including the title of the app.
Here’s how the StartupForm for our app looks in the Anvil Editor:
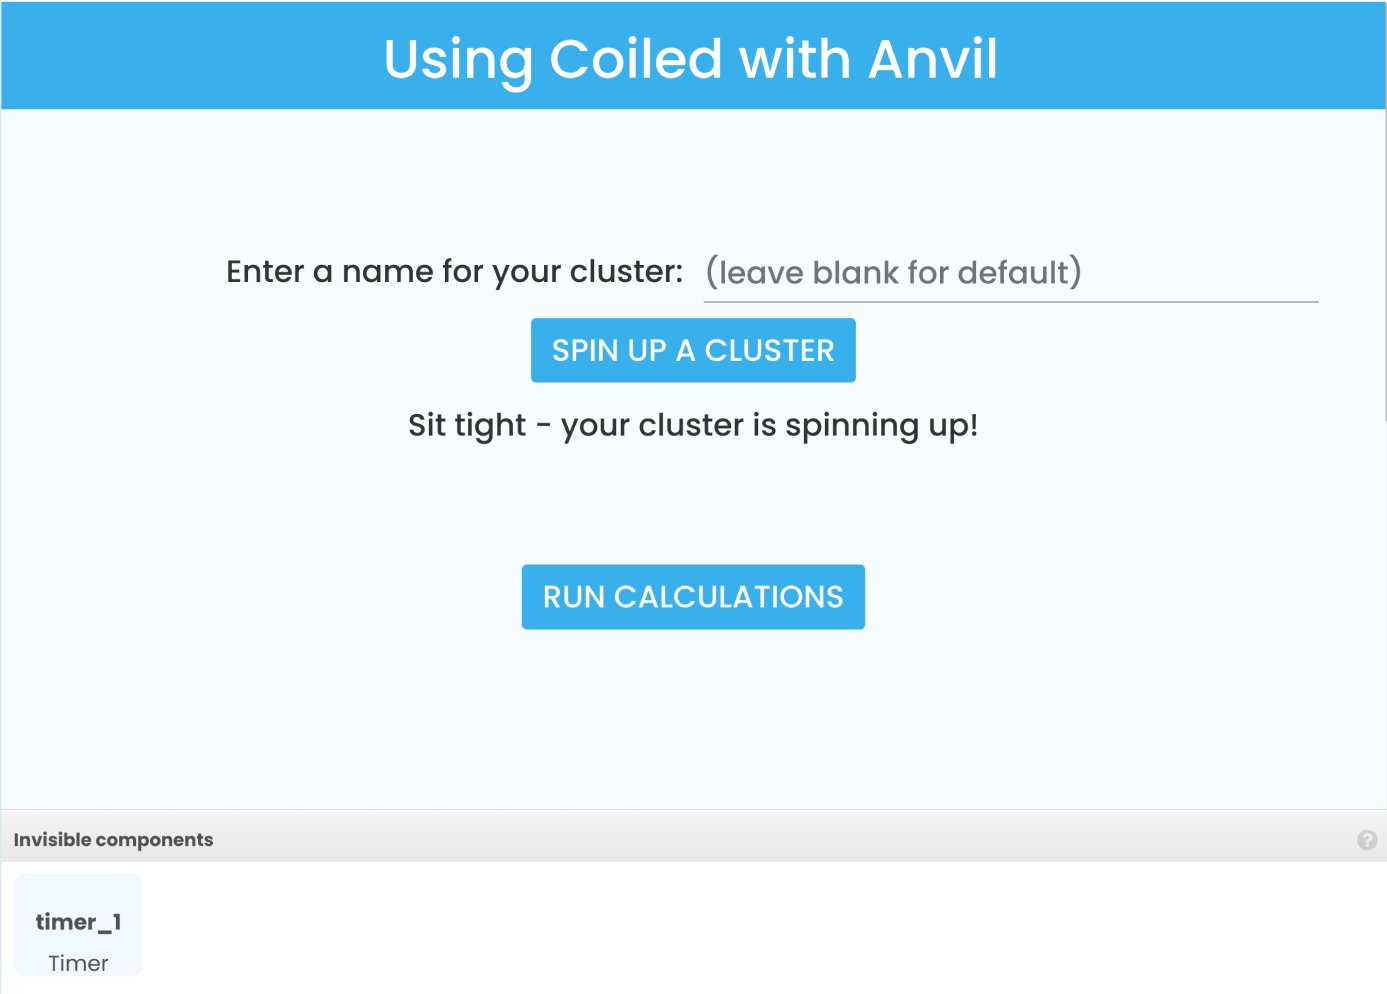
Not every element will be visible at once; in fact, when the Form is loaded, its initialisation sets some of the UI elements to be either disabled or invisible.
At the very bottom, there’s a Timer element. This is an invisible UI element that can regularly and repeatedly execute code, which makes it perfect for checking on the state of any Background Tasks we launch.
Here’s the initialisation code for the Form, in its __init__ method:
  def __init__(self, **properties):
    # Set Form properties and Data Bindings.
    super().__init__(**properties)

    # Any code you write here will run before the form opens.
    self.run_calculations_button.enabled = False
    self.spinning_up_text.visible = False

    self.setup_task_running = False
    self.plot_task_running = False
    self.timer_1.interval = 0
When the Form is loaded, the button to run calculations is disabled, and the text that tells us our cluster is being provisioned is hidden. Later, we’ll use code to make that text visible and to enable that button at the appropriate points during the user flow. The Timer element also has its interval property set to zero, which disables it.
To start with, the user optionally enters a name into the cluster_name_box (the text box at the top of the Form), and then clicks the button that says ‘Spin up a new cluster’. We need this button to make a call to a server function that will spin up a cluster for us, with the appropriate name.
Here’s the Python function that will run in the browser when that button is clicked. It calls a server function, and changes some visual attributes of the UI:
  def spin_up_button_click(self, **event_args):
    """This method is called when the button is clicked"""
    self.cluster_name = self.cluster_name_box.text
    with anvil.server.no_loading_indicator:
      self.setup_task = anvil.server.call('start_cluster', self.cluster_name)
    self.setup_task_running = True
    self.spin_up_button.enabled = False
    self.spinning_up_text.visible = True
    self.timer_1.interval = 1
We can see that the Form stores the text contents of the cluster_name_box as an attribute on itself (with self.cluster_name = ...), and then also passes that name on to the function that will launch our first Background Task.
Next, there’s some state on the client side that needs to be updated; we know that the setup task is now running, so we can disable the button that launches it (that’s the button the user just clicked). We can also show the spinning_up_text label, so that the user knows the task is in progress.
Finally, we enable the Timer (with self.timer_1.interval = 1), so that we can start checking every second to see whether our cluster has finished spinning up.
n_workers or scheduler_options.Once the cluster has spun up, the Background Task that handles it will be completed. We can check for this using our Timer component. Every time our Timer ticks, we can inspect that Background Task objects and see if it’s done yet.
Here’s some of the code that runs every time the Timer ticks:
  def timer_1_tick(self, **event_args):
    """This method is called every [interval] seconds. Does not trigger if [interval] is 0."""
    # Check whether the setup task has completed
    if self.setup_task_running and self.setup_task.is_completed():
      self.setup_task_running = False
      self.run_calculations_button.enabled = True
      self.timer_1.interval = 0
      alert("Your new cluster is ready!")
This code checks on the status of the setup_task, and - if it’s complete - the button to run calculations will be enabled. The Timer disables itself by setting its interval to 0, and sends an alert (a pop-up) to give the user a very clear visual sign that they can now run their calculations.
The button that says ‘Run calculations’ is now enabled. When the user clicks it, we want to run the code that will connect to our new cluster and do the computation we want. Here’s the event handler for the ‘Run calculations’ button:
  def run_calculations_button_click(self, **event_args):
    """This method is called when the button is clicked"""
    with anvil.server.no_loading_indicator:
      self.plot_task = anvil.server.call('execute', self.cluster_name)
    self.plot_task_running = True
    self.timer_1.interval = 1
Just as before, the event handler calls a server function to launch our second Background Task, and enables the Timer element. The Timer element should now also check for the status of the second task, so we’ll add the following code to its event handler:
  def timer_1_tick(self, **event_args):
    """This method is called Every [interval] seconds. Does not trigger if [interval] is 0."""
    # Check whether the setup task has completed
    if self.setup_task_running and self.setup_task.is_completed():
      ... # this is the code in the code block two sections above this one

    # Check whether the plotting task has completed
    if self.plot_task_running and self.plot_task.is_completed():
      self.timer_1.interval = 0
      open_form('ResultsForm', self.plot_task.get_state()['row'])
Once the second Background Task is complete, we’ll have some data to plot, so the Timer accesses that data with self.plot_task.get_state()['row'] and opens the ResultsForm to display it. We’ll take a look at the second Form later - but first, we’ll need to generate that output data! Let’s take a closer look inside that second Background Task.
Wrangling some data
This is the part that’ll be familiar to anyone used to working with data: some computation. This app is just a demo, so we’ll use Dask’s built-in timeseries datasets. This function generates a dataset with one name per second over a set period of time, and using it looks like this:
ddf = dask.datasets.timeseries(
    start="2000-01-01",
    end="2000-01-02",
    freq="5s",
    seed=42,
  )
Once that dataset exists, we use it to create two sets of output showing how many times each name appears in the dataset. For the first plot, we use the whole dataset, and for the second we take a random sample of 0.5% of the dataset.
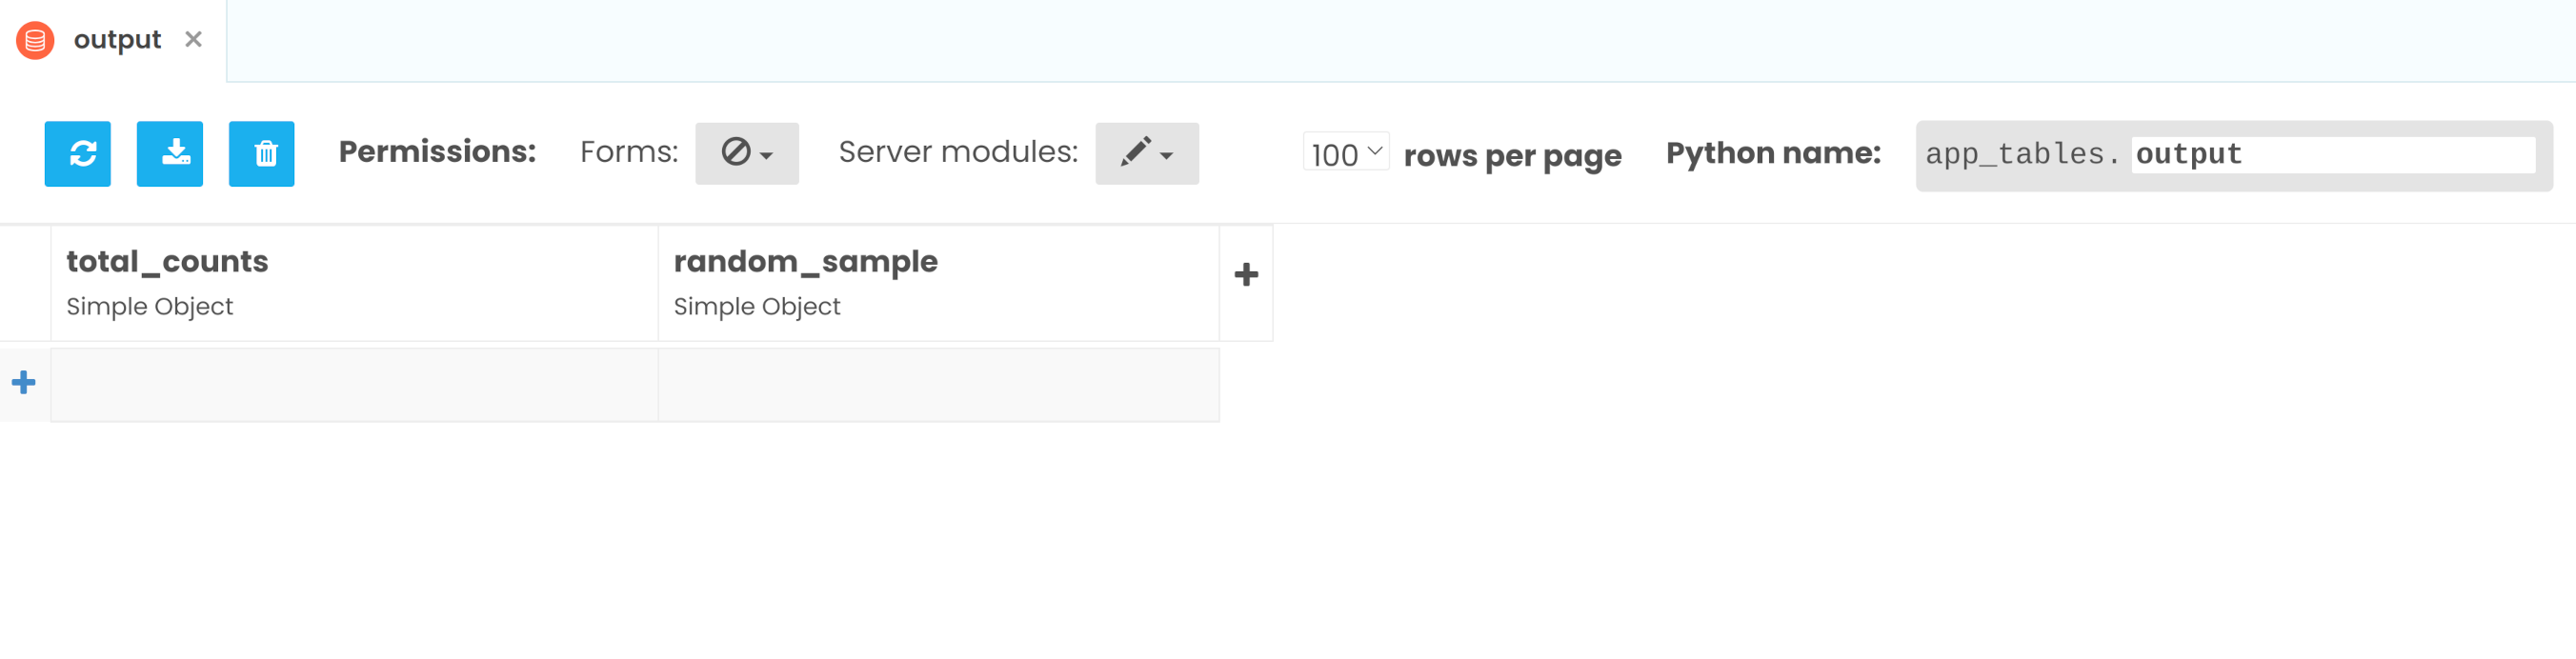
Once we’ve got each of those sets of output - that is, some x-values and y-values - we’ll store them into a Data Table, called output. It’s best practice not to leave large amounts of data in the state of a Background Task, but we can store simple Python objects - like lists - in Simple Object columns in a Data Table. Then, we can retrieve that Data Table row from the Background Task’s state once the task has completed.
Here’s what the Data Table for storing our outputs looks like:
Here’s the code for calculating and storing the frequencies of all the names in our dataset:
# create a new Data Table row to store our outputs
row = app_tables.output.add_row()

# get the frequency for each name
total_counts = ddf.groupby(ddf.name).count().drop(labels=["x", "y"], axis=1).compute()['id']

# store the x- and y-values as a list of lists in a Data Table
row['total_counts'] = [total_counts.index.values, total_counts.values]

# return this output in the Background Task's state
anvil.server.task_state['row'] = row
We can do the same for a random sample of 0.5% of our dataset. And with that, the data wrangling is done!
Plotting our data
Now that we’ve got some output from our data in the form of two sets of x- and y-values, we want to display them to the end user. To do this, we’ll build a second Form called ResultsForm which will plot our output data, and display it to the user in the browser. This Form will also be used to create a PDF version of the output, so the user can download and keep it.
The ResultsForm is visually very simple - just two Plots, a Label for each, and some buttons at the bottom for the user to either download this page as a PDF, or to return to the previous Form.
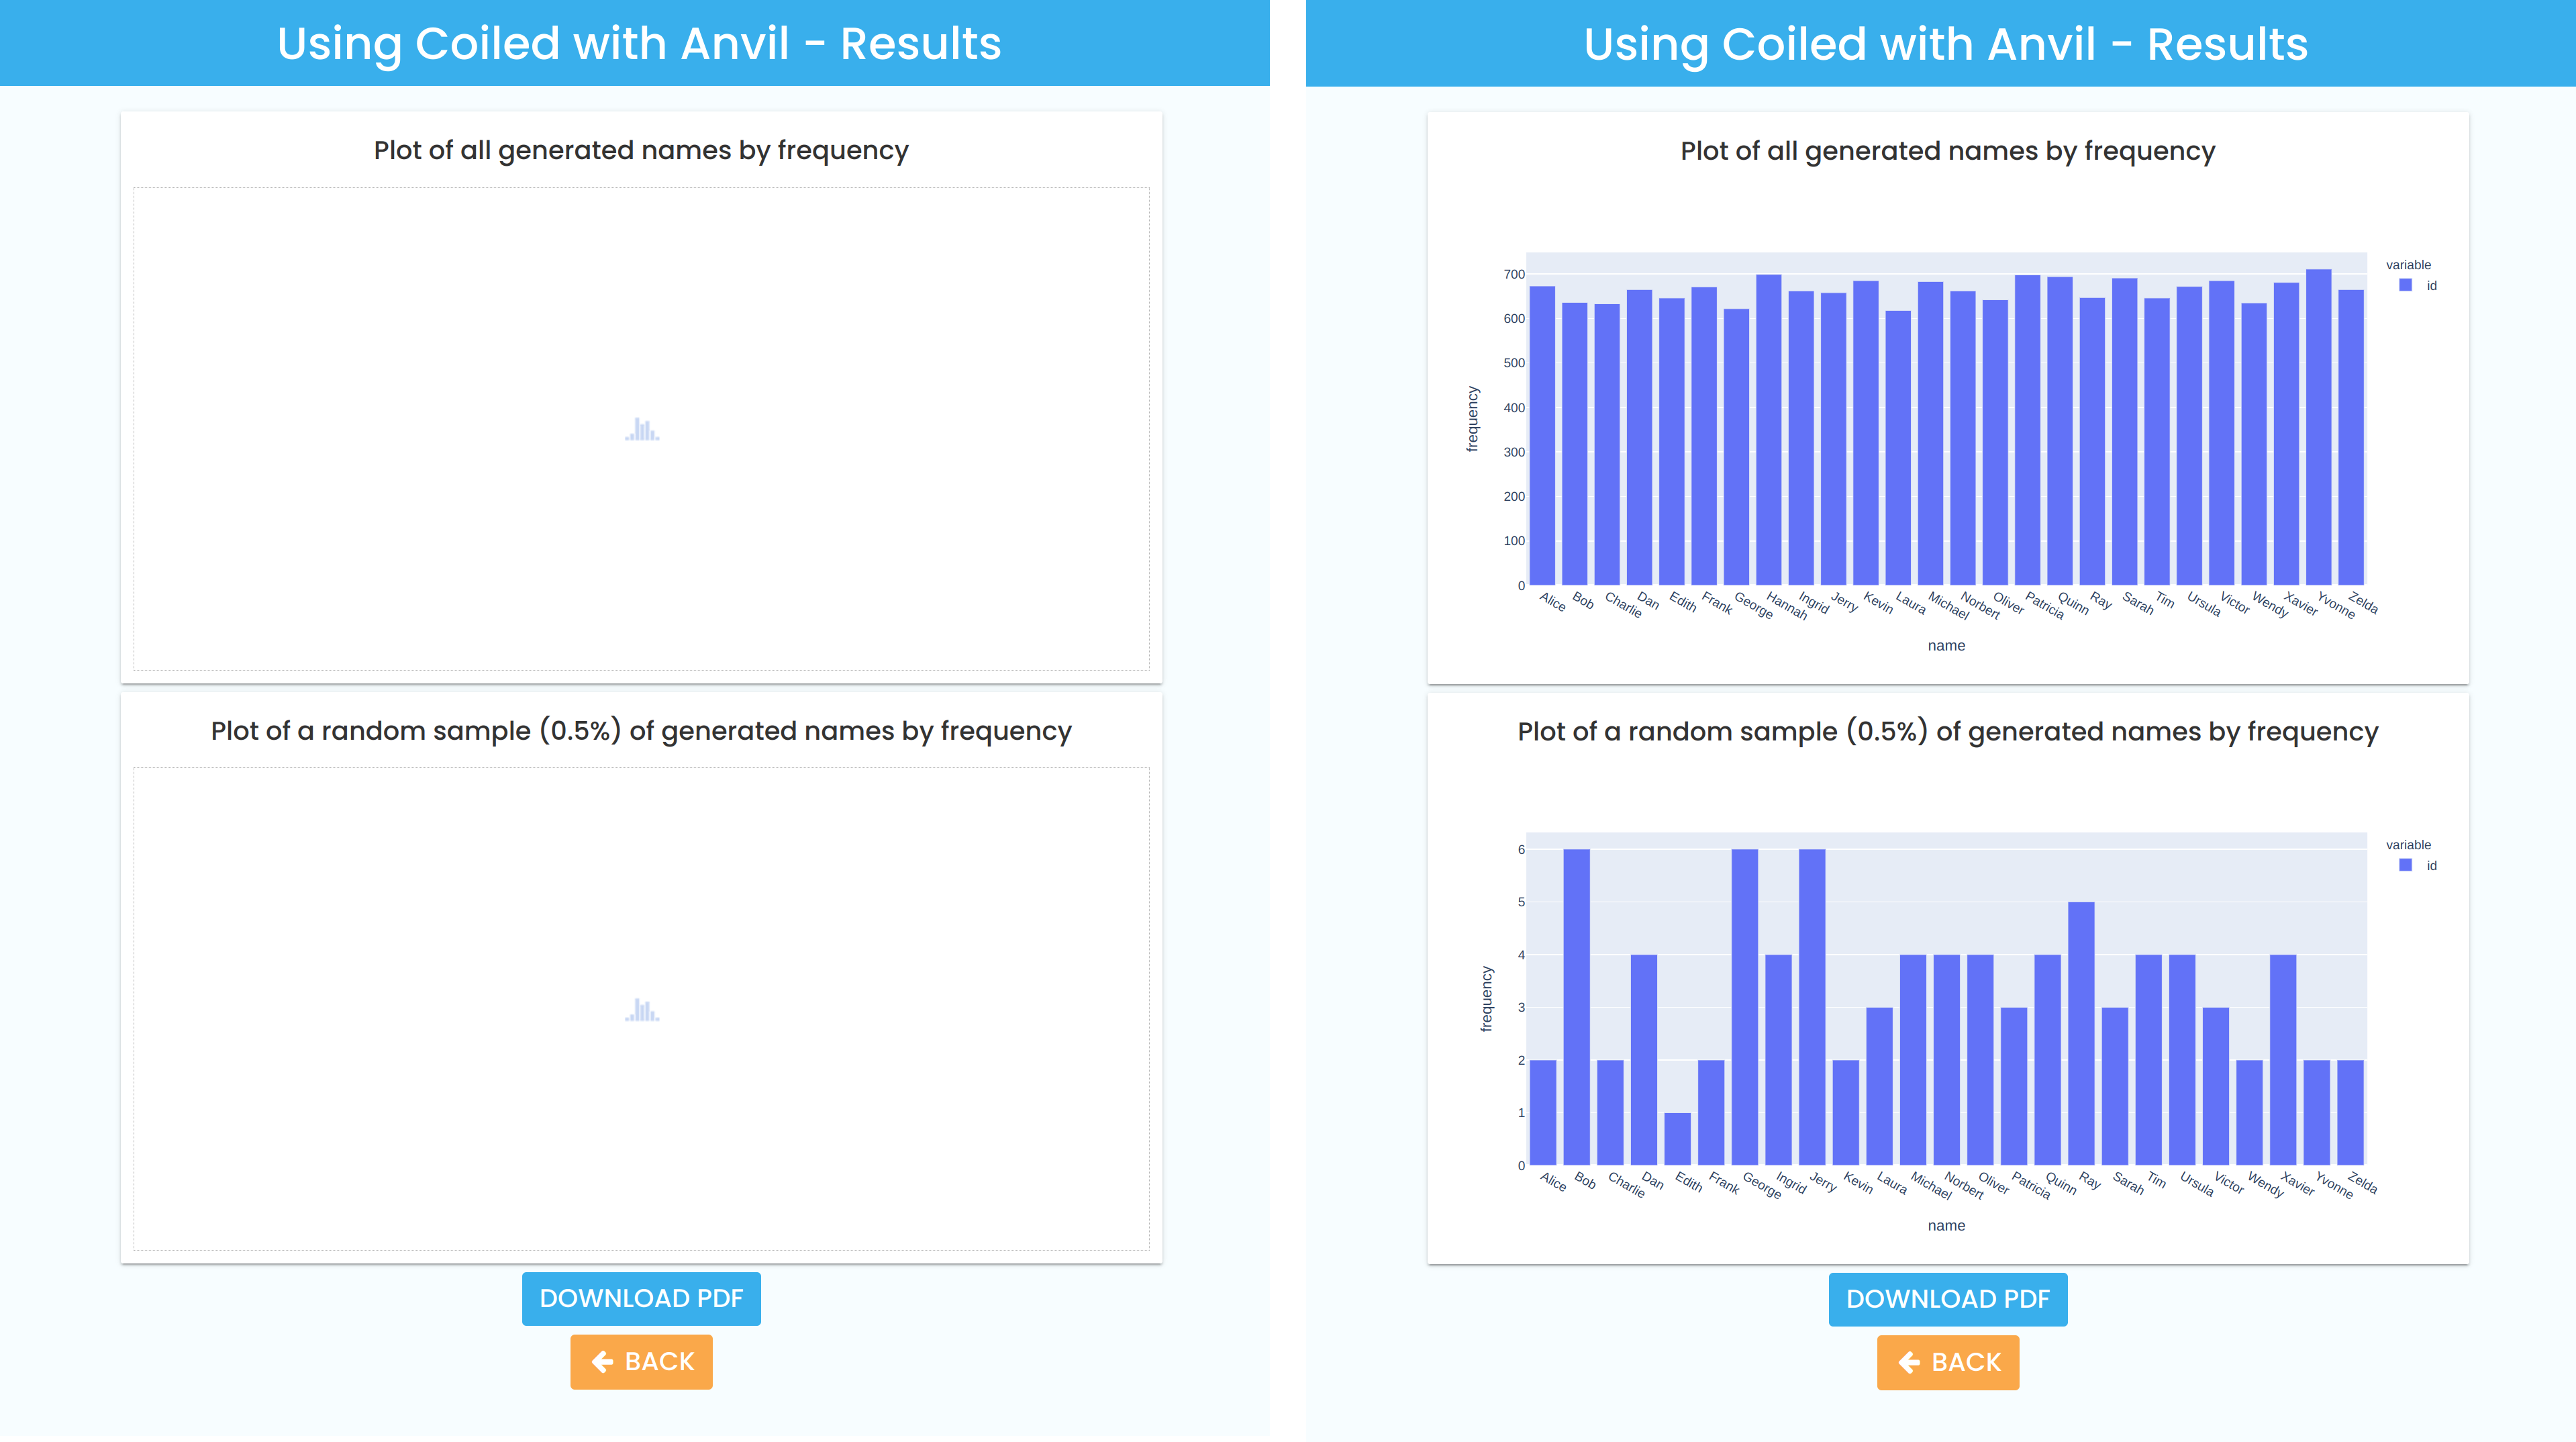
On the left, you can see how the ResultsForm looks in the Anvil Editor, and on the right you can see it populated with bar plots.
This Form is loaded from the Timer element on our first form, the StartupForm, after the computation task finishes, and at this point the output data is passed through to the ResultsForm. So, when this new Form loads, we want it to use that output data to generate some plots, and we can write the code to do that in the ResultsForm’s __init__ method.
Anvil has client-side integration with Plotly, which means we can use graph_objects to turn our output data into bar plots, and display those in the Form’s Plot components.
Here’s some of the code that runs in the ResultsForm’s __init__ method:
  def __init__(self, row, ...):
    ...

    import plotly.graph_objects as go

    # get the latest set of output data from our Data Table
    total_plot_data = row['total_counts']
    self.total_plot.data = go.Bar(
        x = total_plot_data[0],
        y = total_plot_data[1]
      )

    random_sample_data = row['random_sample']
    self.random_plot.data =  go.Bar(
        x = random_sample_data[0],
        y = random_sample_data[1]
      )
This code uses the row variable that was passed in from the calling code in the StartupForm, and uses it to create bar plots which are displayed in the Plot components on the ResultsForm.
Generating PDF output
Anvil can render any Form as a PDF and make it available for user download. However, if we’re rendering our ResultsForm as a PDF, we don’t necessarily want all the UI elements on it - such as the buttons - to be included. We want to have conditional formatting for the Form, depending on how it’s being rendered.
To make this happen, the ResultsForm has an optional variable in its __init__ method, as_pdf=False. We use this to optionally show various bits of the Form depending on whether it’s being shown in the browser, or rendered as a PDF. This way, when we want to render the Form as a PDF, we can pass as_pdf=True, and the Form can use that flag to hide any extraneous UI elements:
  def __init__(self, row, as_pdf=False, **properties):

    ...

    if as_pdf:
      self.pdf_button.visible = False
      self.return_button.visible = False
When the Form is opened in the browser, as_pdf will always be False, so the buttons will show. When we create the PDF, we can set this variable to True, hiding the buttons.
Turning this Form into a PDF happens on the server side, in a function that looks like this:
@anvil.server.callable
def get_pdf(row):
  pdf = anvil.pdf.PDFRenderer(
    quality="original",
    page_size="A4",
    filename="Anvil Coiled Results.pdf"
  ).render_form(
    'ResultsForm',
    row, # pass in the output data so the Form can generate its plots
    True # sets the `as_pdf` variable to `True`
  )
  return pdf
That function is called from the ‘Download PDF’ button’s event handler in the browser, and the PDF is then downloaded. Here’s that event handler:
  def pdf_button_click(self, **event_args):
    """This method is called when the button is clicked"""
    pdf = anvil.server.call('get_pdf', self.row) # self.row = row was set in the Form's __init__ method
    anvil.media.download(pdf)
To learn more about creating and downloading PDFs with Anvil, check out our feature guide here.
Wrapping up
And that’s it! In this walkthrough, we’ve seen how to build an app that integrates with Coiled to let a user spin up a cluster and run computations with it. We’ve also seen how to build a flexible, extensible UI in Anvil, so that we can share this functionality by publishing our app.
Going even further
This app is just a demo, showing the bare bones of how you can use Anvil to run Coiled code. In the real world, you’d be using a proper dataset, and likely allowing the end user to configure far more options for their clusters than just what’s demonstrated here. You could have all sorts of different available computations, taking parameters from the users; you could make more use of Plotly’s interactivity on the front-end, and you could use Anvil’s built-in user authentication to restrict actions like cluster provisioning to certain users. You could even store configuration options in a Data Table, and allow users to choose between multiple different Coiled profiles.
If you do want to tinker with this for yourself, all you need to do is clone this app into your own Anvil account, set your configuration details, and put your own Coiled API token into your app’s Secrets. Have fun!
More about Anvil
If you’re new here, welcome! Anvil is a platform for building full-stack web apps with nothing but Python. No need to wrestle with JS, HTML, CSS, Python, SQL and all their frameworks – just build it all in Python.
Learn More
Get Started with Anvil
Nothing but Python required!
Seven ways to plot data in Python

Python is the language of Data Science, and there are many plotting libraries out there.
Which should you choose?
In this guide, we introduce and explain the best-known Python plotting libraries, with a detailed article on each one.
Deploy data science to the web with Deepnote
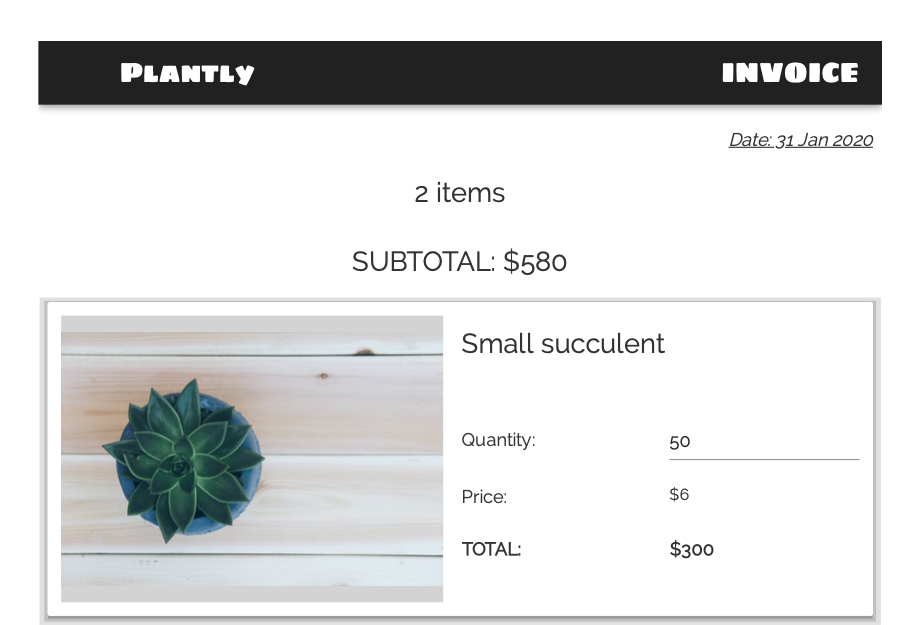
Generate PDF Invoices with Python
Rapid Prototyping: Building Calendly in 3 Hours