
Making plots in Anvil
The recommended way to make plots in Anvil is to use Anvil’s Plot component. This uses Anvil’s client-side Python Plotly library, so you can configure and reconfigure the plot dynamically without making a round-trip to the server.
A Plotly plot created in Anvil using Graph Objects in the client code.
Using Other Plotting Libraries
Because Anvil code is just Python, it’s simple to use lots of different plotting libraries with Anvil. This page gives instructions for some of the most popular.
If your favourite is not here, it may have been mentioned on the Forum. If it hasn’t, please start a new thread about it!
There’s also a comprehensive comparison of the best-known Python plotting libraries on the Anvil blog.
Contents
There are three main types of plotting library in Python. We’ll show you how to use each of them:
-
The Matplotlib family: Matplotlib, Seaborn and Pandas
-
The HTML generators: Bokeh, Altair and Pygal
-
The client-side library: Plotly
plotly.express with Anvil, check out our Plotly Express in Anvil how-to guide.Matplotlib, Seaborn and Pandas
Matplotlib, Seaborn and Pandas all render plots on the server-side. To display a plot on the client, you can export it as an image in a Media object.
There’s a simple function to do this – and it’s the same for all three libraries, since Seaborn and Pandas are based on Matplotlib.
Instead of calling plt.show() to display the plot on your screen, in Anvil you call
anvil.mpl_util.plot_image() to render it as an image.
That function returns a Media object, so you can return it to the client code and display it
in an Image component. You could also offer the image for download (with the Link component), or even add it to a database.
Let’s look at a full example.
Full example: Matplotlib
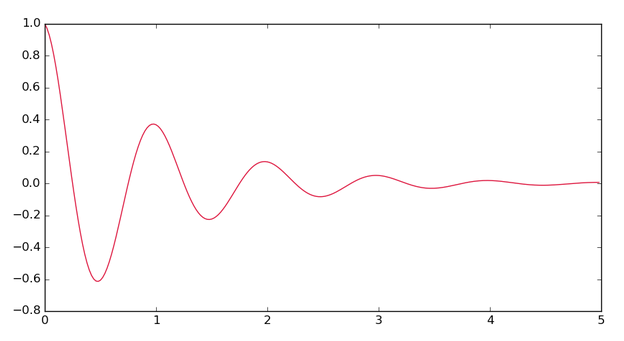
We’re going to walk through a simple Matplotlib example that makes a graph like this:
Matplotlib is included in Anvil’s Python 3.10 server environment as part of the Data Science Base Environment.
Here’s the server function that makes our plot:
import anvil.mpl_util

import numpy as np
import matplotlib.pyplot as plt

@anvil.server.callable
def make_plot():
  # Make a nice wiggle
  x = np.arange(0.0, 5.0, 0.02)
  y = np.exp(-x) * np.cos(2*np.pi*x)

  # Plot it in the normal Matplotlib way
  plt.figure(1, figsize=(10,5))
  plt.plot(x, y, 'crimson')

  # Return this plot as a PNG image in a Media object
  return anvil.mpl_util.plot_image()
This returns an Anvil Media object.
Here’s the client-side code to display that plot and make it downloadable:
  def __init__(self, **properties):
    # Set Form properties and Data Bindings.
    super().__init__(**properties)

    # Any code you write here will run before the form opens.
    media_obj = anvil.server.call('make_plot')
    self.image_1.source = media_obj
    self.download_link.url = media_obj
This produces the plot shown in the image above.
Click here to open the full source code for that example in your Anvil Editor:
Here’s a clone link for the same example using Seaborn:
Here’s a clone link for the same example using Pandas:
Bokeh, Altair and Pygal
Bokeh, Altair and Pygal produce HTML or SVG plots that you can display in an IFrame. This gives you dynamic plots in the browser.
You will need an IFrame component to display them in. Here’s a clone link that gives you an IFrame component you can use as a dependency:
These libraries write out their plots as an HTML or SVG file. In Anvil you can turn this file into a
Media object using anvil.media.from_file:
  # Generate a Media object containing the plot
  media_object = anvil.media.from_file('/tmp/altair.html', 'text/html')
You can then set the src of the IFrame to a “data URL” obtained from the Media object. See below for a full example.
Full example: Bokeh
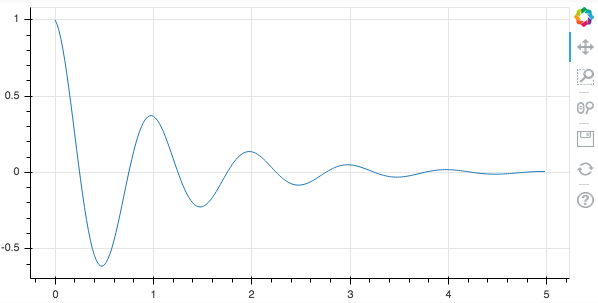
Here’s an example of plotting in Anvil using Bokeh. We’ll make the same line plot as we did for Matplotlib:
First, we include the IFrame component as a dependency:
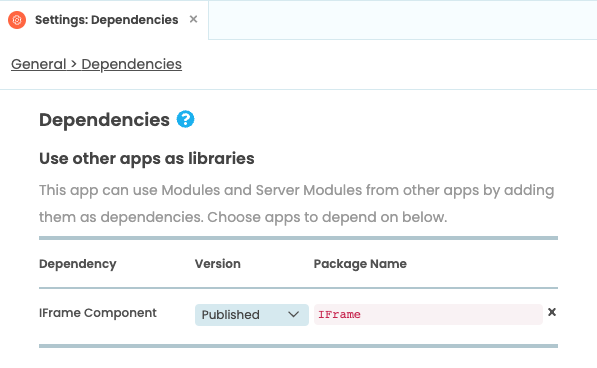
Adding the IFrame component as a dependency.
This makes it available in the Toolbox so we can drag-and-drop it onto our main Form:
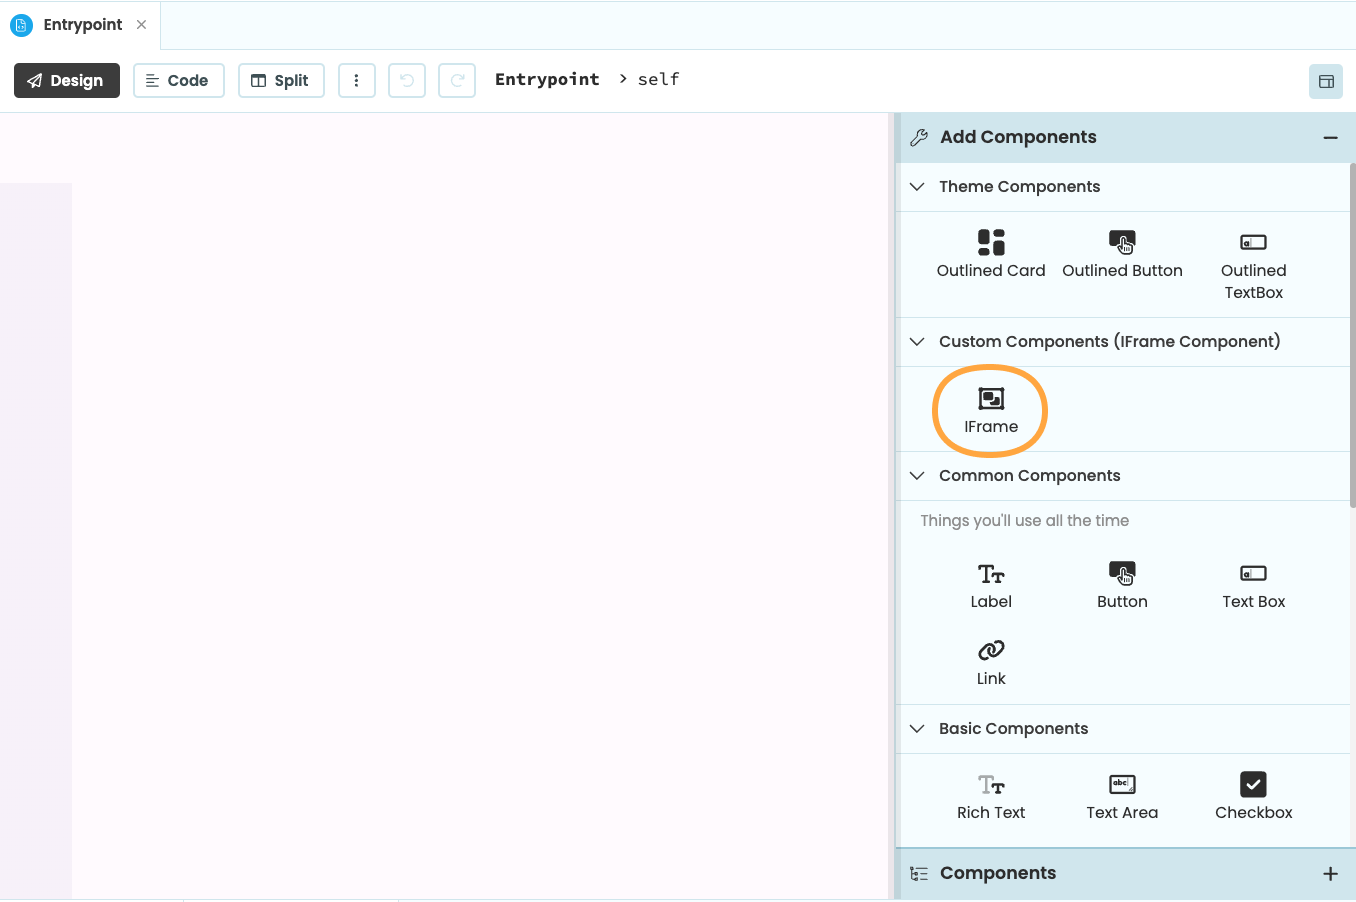
We’ve dropped an IFrame component onto the Form (it’s the empty white rectangle).
Then we add some lines to the Form’s __init__ method that fetch a Media object from the server. The Media object contains the HTML of the plot. We assign its URL to the url of the IFrame component:
  def __init__(self, **properties):
    # Set Form properties and Data Bindings.
    super().__init__(**properties)

    # Any code you write here will run before the form opens.
    media_obj = anvil.server.call('make_plot')
    self.i_frame_1.url = media_obj.get_url(True)
Here’s the server function that makes the plot and returns it as a Media object to the client:
import anvil.server
import anvil.media

import numpy as np
from bokeh.plotting import figure, output_file, show

@anvil.server.callable
def make_plot():
  # Point Bokeh at a file
  output_file("/tmp/bokeh.html")

  # Make a nice wiggle
  x = np.arange(0.0, 5.0, 0.02)
  y = np.exp(-x) * np.cos(2*np.pi*x)

  # Plot it in the usual Bokeh way
  p = figure(width=600, height=300)
  p.line(x, y)

  # Save the plot
  show(p)

  # Return this plot as HTML in a Media object
  return anvil.media.from_file('/tmp/bokeh.html', 'text/html')
This produces the plot shown in the image above.
Here’s a clone link for that example:
Here’s a clone link for the same example using Altair:
Here’s a clone link for the same example using Pygal:
The Pygal example doesn’t need to write to a file, since Pygal has a render method to output an SVG as a bytestring:
  c = pygal.Line(show_dots=False, width=400, height=200)

  # ...

  return anvil.BlobMedia(content=c.render(), content_type='text/html', name='pygal.svg')
Plotly
Anvil has Plotly’s Graph Objects built into its client-side Python, so you can construct Plotly plots on the client side in the same way you would construct them using Graph Objects locally. Use Anvil’s Plot component to show the plot in your app. For full details, see the Plot component documentation:
Here’s the same graph shown in the examples above, but this time as a front-end Plotly plot:
A Plotly plot created in Anvil using Graph Objects in the client code.
Here’s a clone link for that app:
On the client side, it’s simply:
class Form1(Form1Template):

  def __init__(self, **properties):
    # Set Form properties and Data Bindings.
    super().__init__(**properties)

    # Any code you write here will run before the form opens.
    x, y = anvil.server.call('get_data')
    self.plot_1.data = go.Scatter(x=x, y=y, mode='lines')
and the data is fetched from the server using this server function:
import anvil.server
import numpy as np


@anvil.server.callable
def get_data():
  x = np.arange(0.0, 5.0, 0.02)
  y = np.exp(-x) * np.cos(2*np.pi*x)

  return x, y
Do you still have questions?
Our Community Forum is full of helpful information and Anvil experts.