 By
By Chapter 2:
Build the user interface
Now that we have our data added to our app and the Python environment is configured, we can actually start building our app.
Step 1: Add a title
Navigate to ‘App’ in the sidebar menu, then choose Form1. Here we can see the Design view of our app. Drag and drop a Label from the Toolbox and add it to the top of the app. In the Properties Panel, change the label’s text to “Uber Pickups in NYC” and its role to ‘headline’.
Step 2: Add the plots
Our dashboard is going to have two plots: a histogram of the number of pickups per hour and a map of the pickup locations. Drag and drop two plot components to the Form and two Labels to act as titles for the plots. Change the name property of one plot to be bar_chart and the other to be mapbox_map.
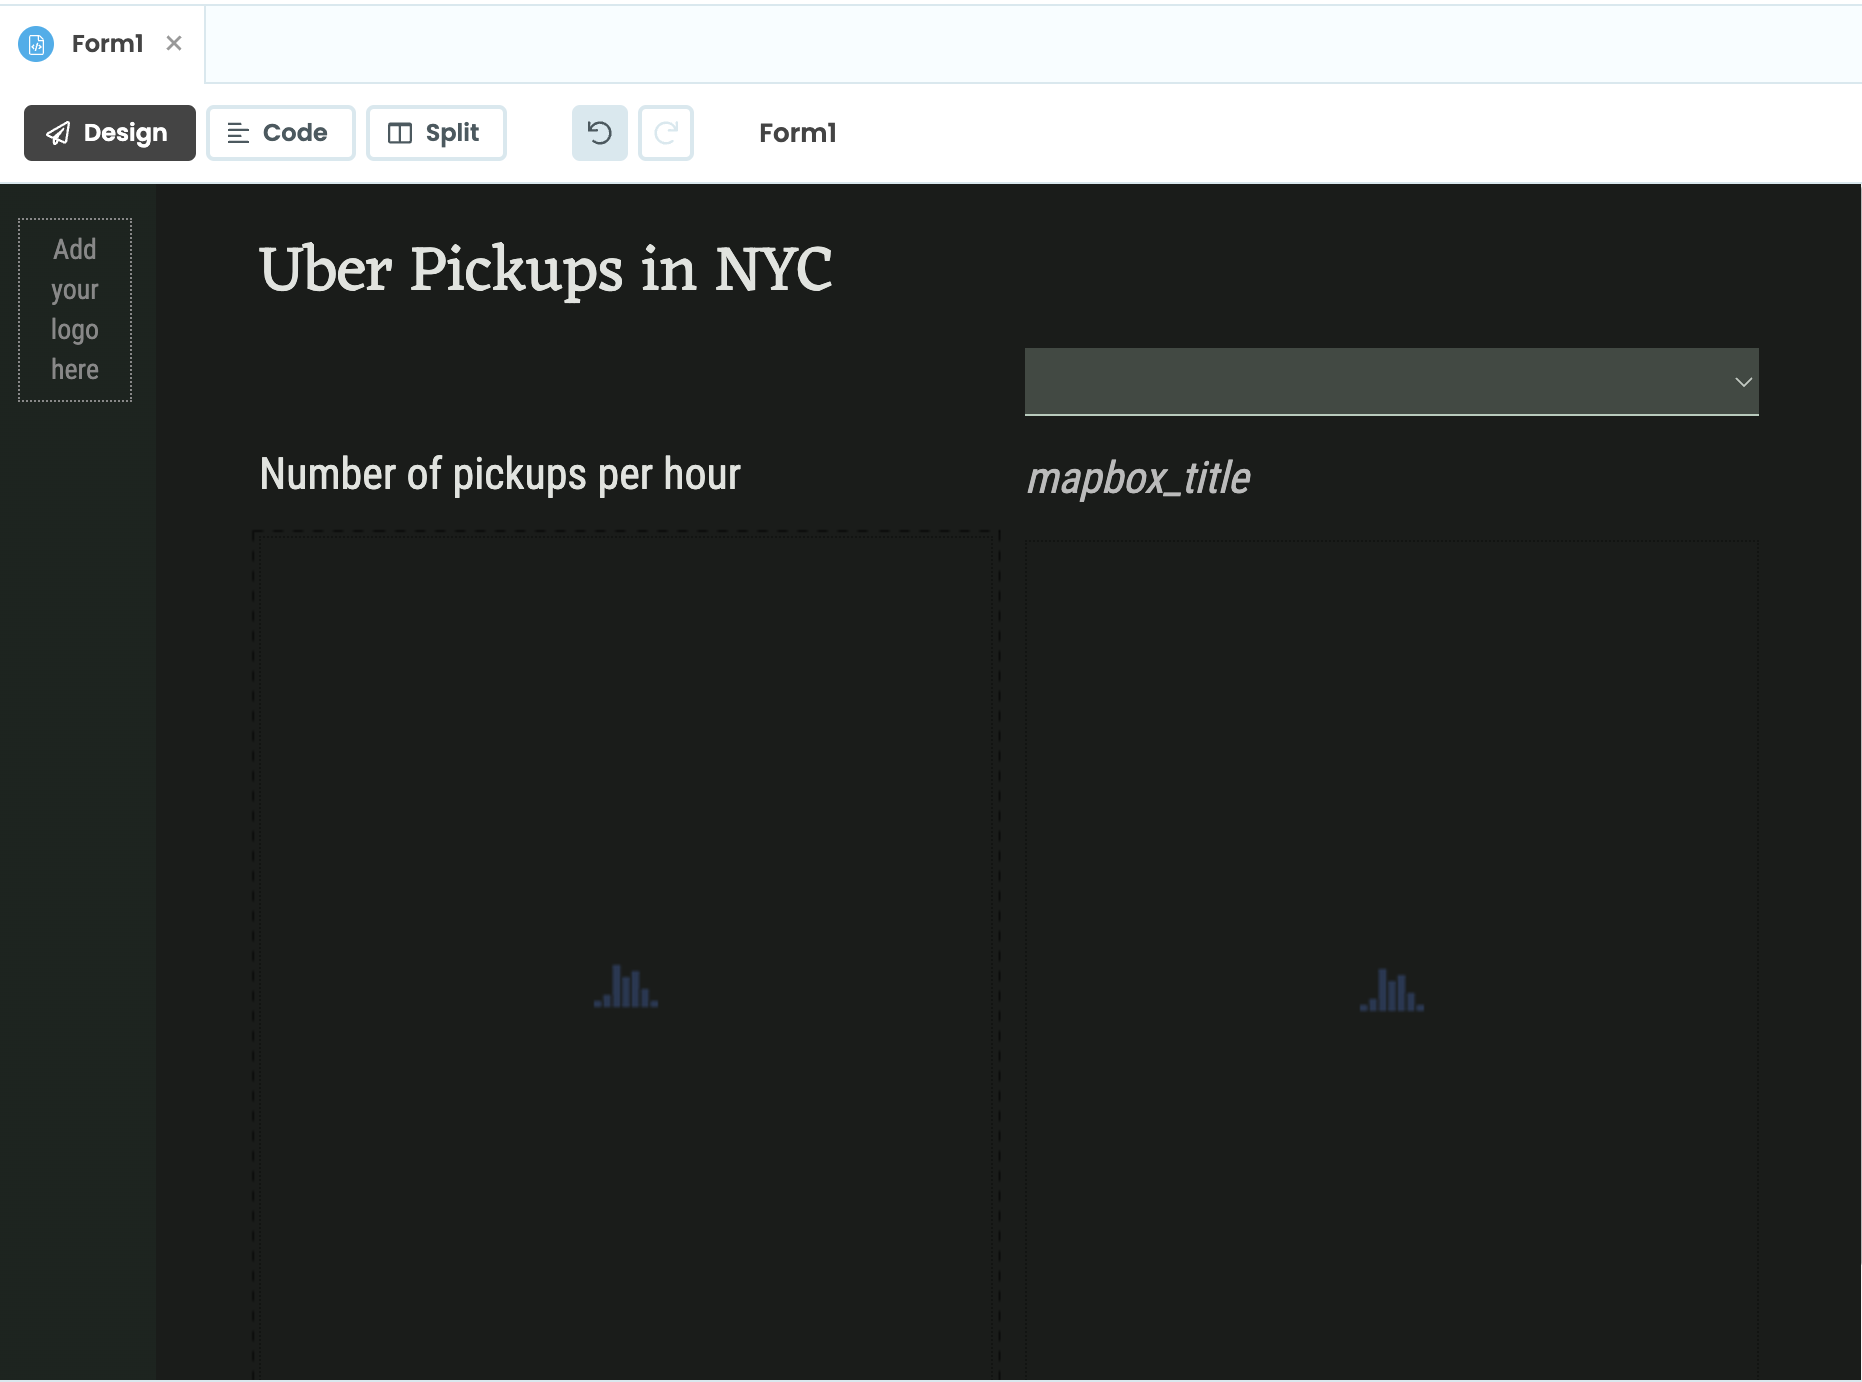
Change the Label above the bar_chart to be “Number of pickups per hour” and change its role to ’title’. We’ll set the other Label’s text property in code, so we can leave that blank. Change its name to mapbox_title and its role to ’title'.
We’re going to want users to be able to filter the map data based on the hour of pickup. Add a DropDown component above the mapbox_map and rename it to hour_dropdown. We’ll populate the dropdown later in code. (You can add a Spacer component over the bar_chart title to make the UI look more even)
Our Form should now look something like this:
In Chapter 3, we’ll set up a function to read our CSV data and take a look at the first few lines.