 By
By Chapter 3:
Examine the data
We now have a UI built for our dashboard, but before we actually create our plots, let’s explore our dataset. Our dataset is stored in our app’s Data Files, which we can only access from server code.
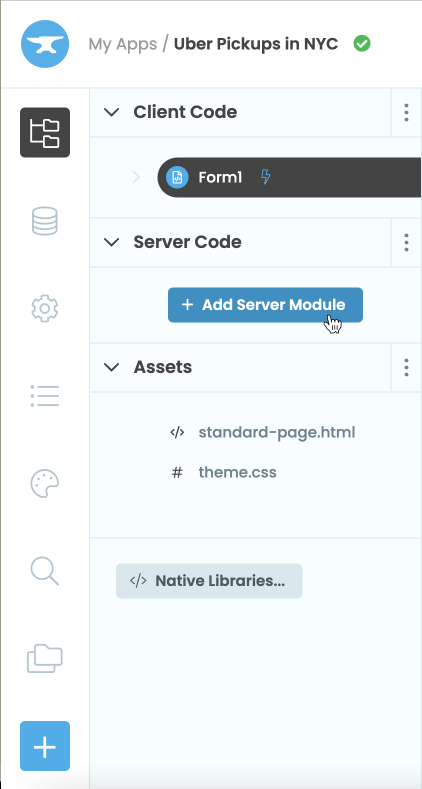
In the App Browser, add a new server module.
Add the following import statements to the module:
import pandas as pd
import numpy as np
import plotly.graph_objects as go
Let’s add a function to read our CSV file and print out the first few rows using pandas. We can access our CSV file with data_files['uber-raw-data-sep14.csv']:
@anvil.server.callable
def get_uber_data():
    #read in 10000 rows of data
    df = pd.read_csv(data_files['uber-raw-data-sep14.csv'], nrows=10000)
    #print the first 5 rows of the dataframe
    print(df.head())
Decorating the function with @anvil.server.callable means we can call the function from our client Form.
Switch back to Form1 then switch to Code view. Call the server function we just wrote in Form1’s __init__ method:
class Form1(Form1Template):

  def __init__(self, **properties):
    # Set Form properties and Data Bindings.
    self.init_components(**properties)
    #call the server function
    anvil.server.call("get_uber_data")
You should see output that looks like this in the App Console:
          Date/Time      Lat      Lon    Base
0  9/1/2014 0:01:00  40.2201 -74.0021  B02512
1  9/1/2014 0:01:00  40.7500 -74.0027  B02512
2  9/1/2014 0:03:00  40.7559 -73.9864  B02512
3  9/1/2014 0:06:00  40.7450 -73.9889  B02512
4  9/1/2014 0:11:00  40.8145 -73.9444  B02512
We can see that we have Date/Time, Lat, Lon and Base columns. We won’t need the Base column but we’ll use the Lat and Lon columns when plotting our map data and the Date/Time column for both the histogram and map plots.
In the next chapter, we’ll use the CSV data to create a histogram of all the Uber pickups by hour.