Chapter 1:
Import the dataset and packages
Step 1: Create the dataset
The first thing we need to do is download our dataset, which you can find here: Uber Pickups in New York City | Kaggle.
In this tutorial, I’m using the uber-raw-data-sep14.csv dataset, which includes time and location data of Uber pickups in New York City during September 2014.
Step 2: Create an app and add the data
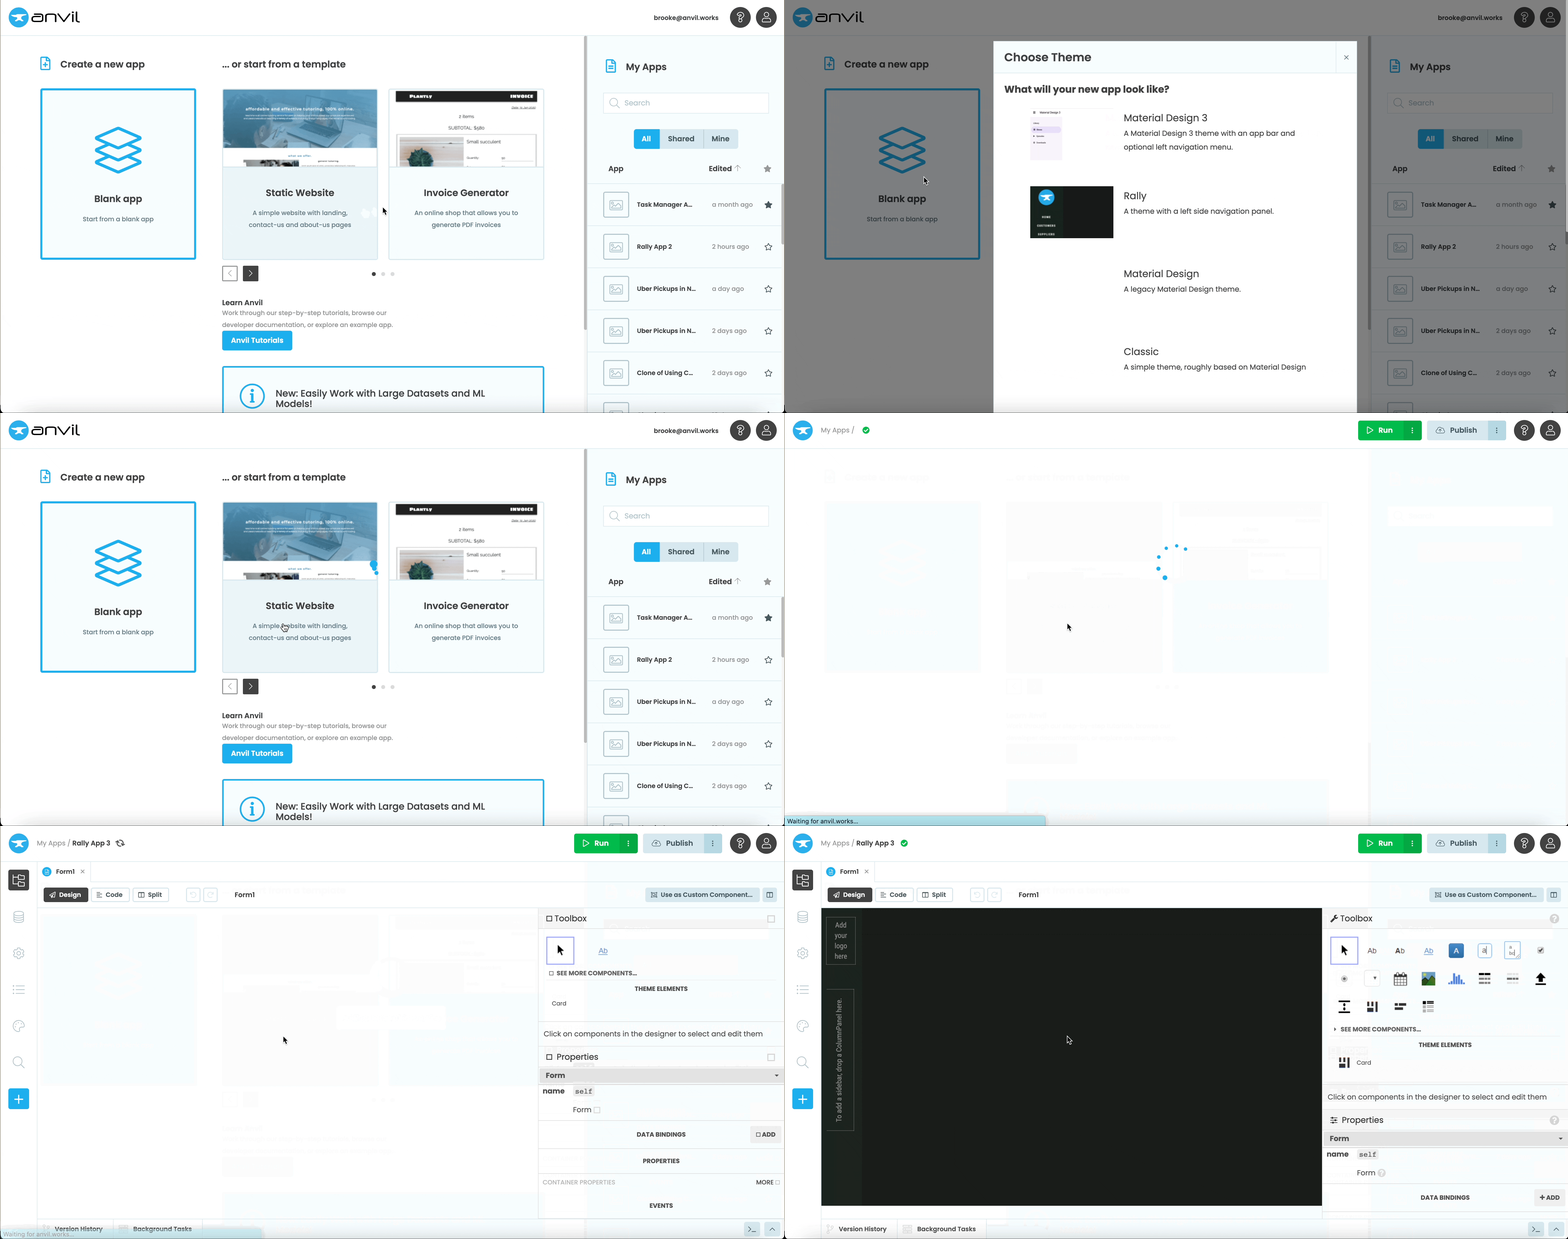
Once we have the dataset downloaded, we can create a new Anvil app. Go to Anvil, create a new blank app and choose the Rally theme. In the top left, you’ll see the name of your app. Click on this and change it to “Uber Pickups in NYC”.

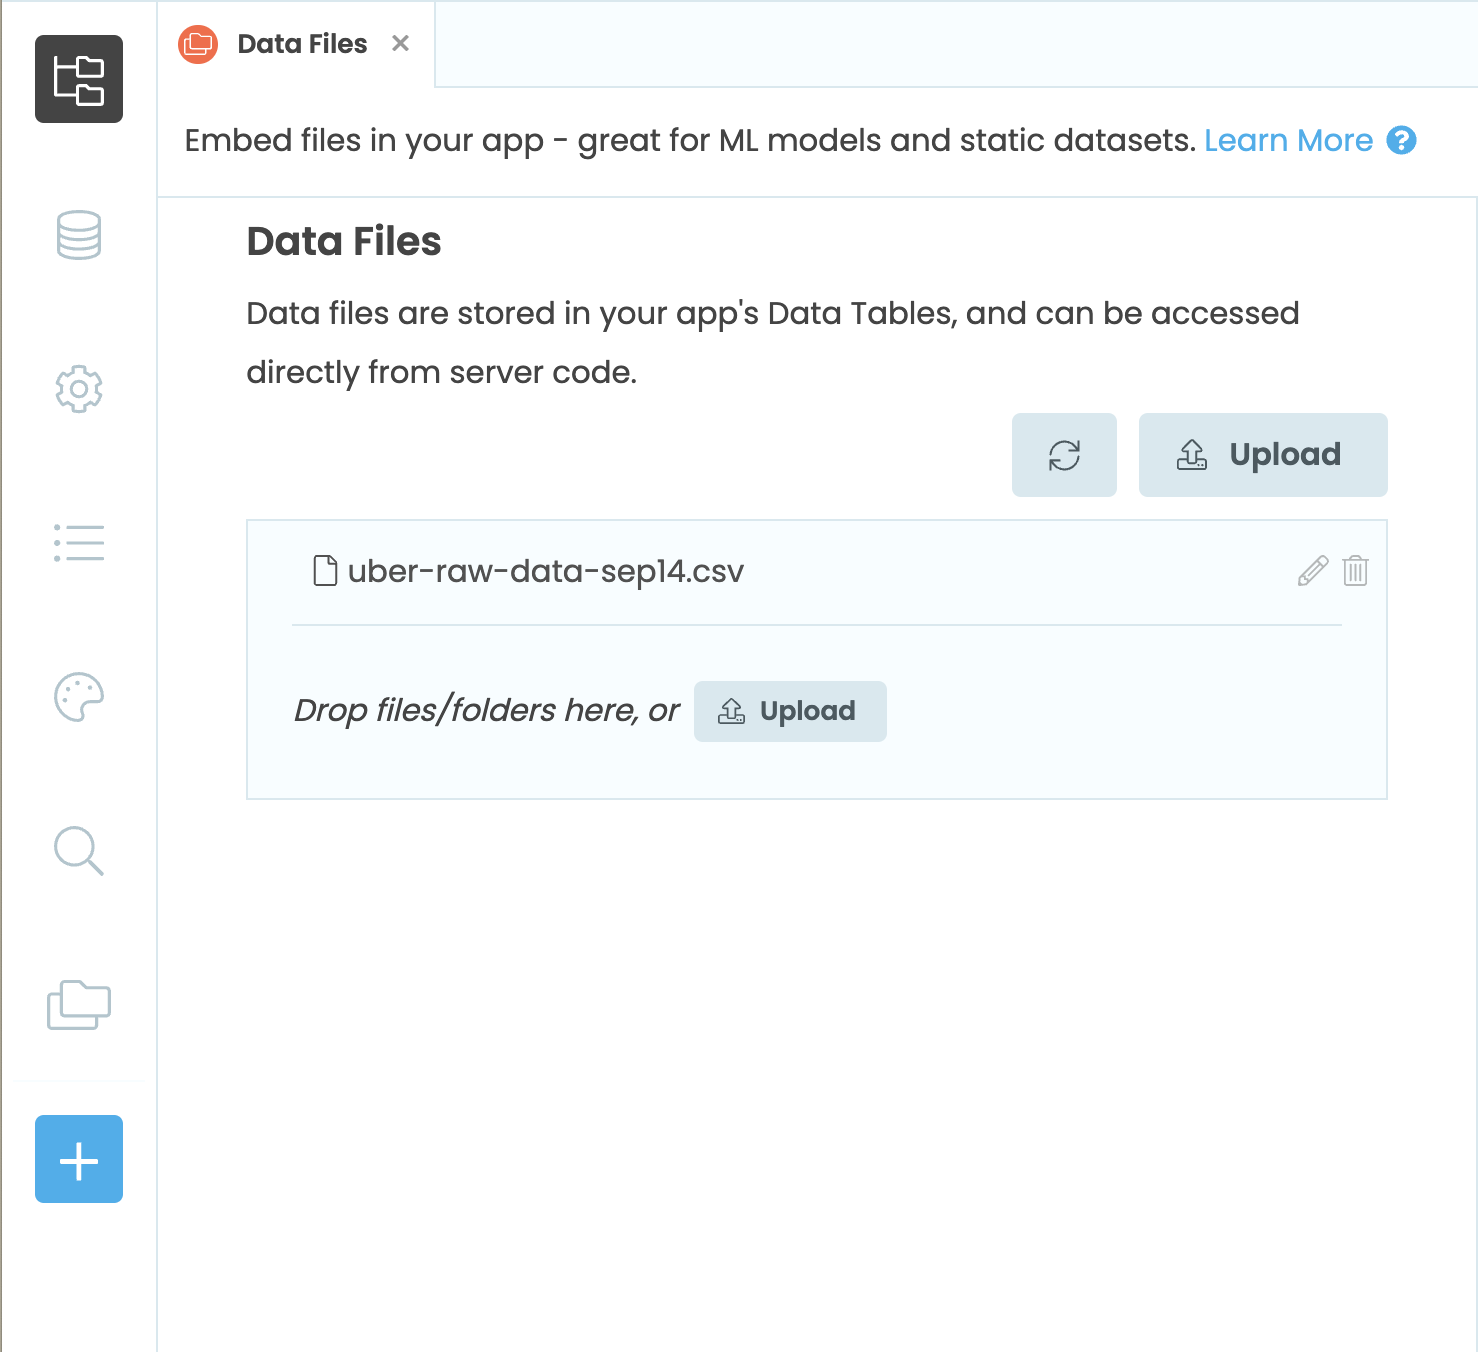
Next, add the Data Files service by choosing the blue plus button in the Sidebar Menu then selecting Data Files.

Now we can upload our dataset to our Anvil app. Click the Upload button and select the dataset we just downloaded. You can also drag and drop the file in order to add it to the app. When the upload is complete, you will see the file listed.

Step 3: Configure the Python environment
We’ll be using pandas and numpy to build our app, so we’ll need to modify the Python environment that is running our app.
Choose Settings from the Sidebar Menu, then Python Versions. Switch the app to Python 3.10, then choose the Data Science base package. This will have the libraries we need pre-installed.
Now that we’ve imported our data and Python packages, we can build the UI for our app.
 By
By