Chapter 6:
Respond to user input
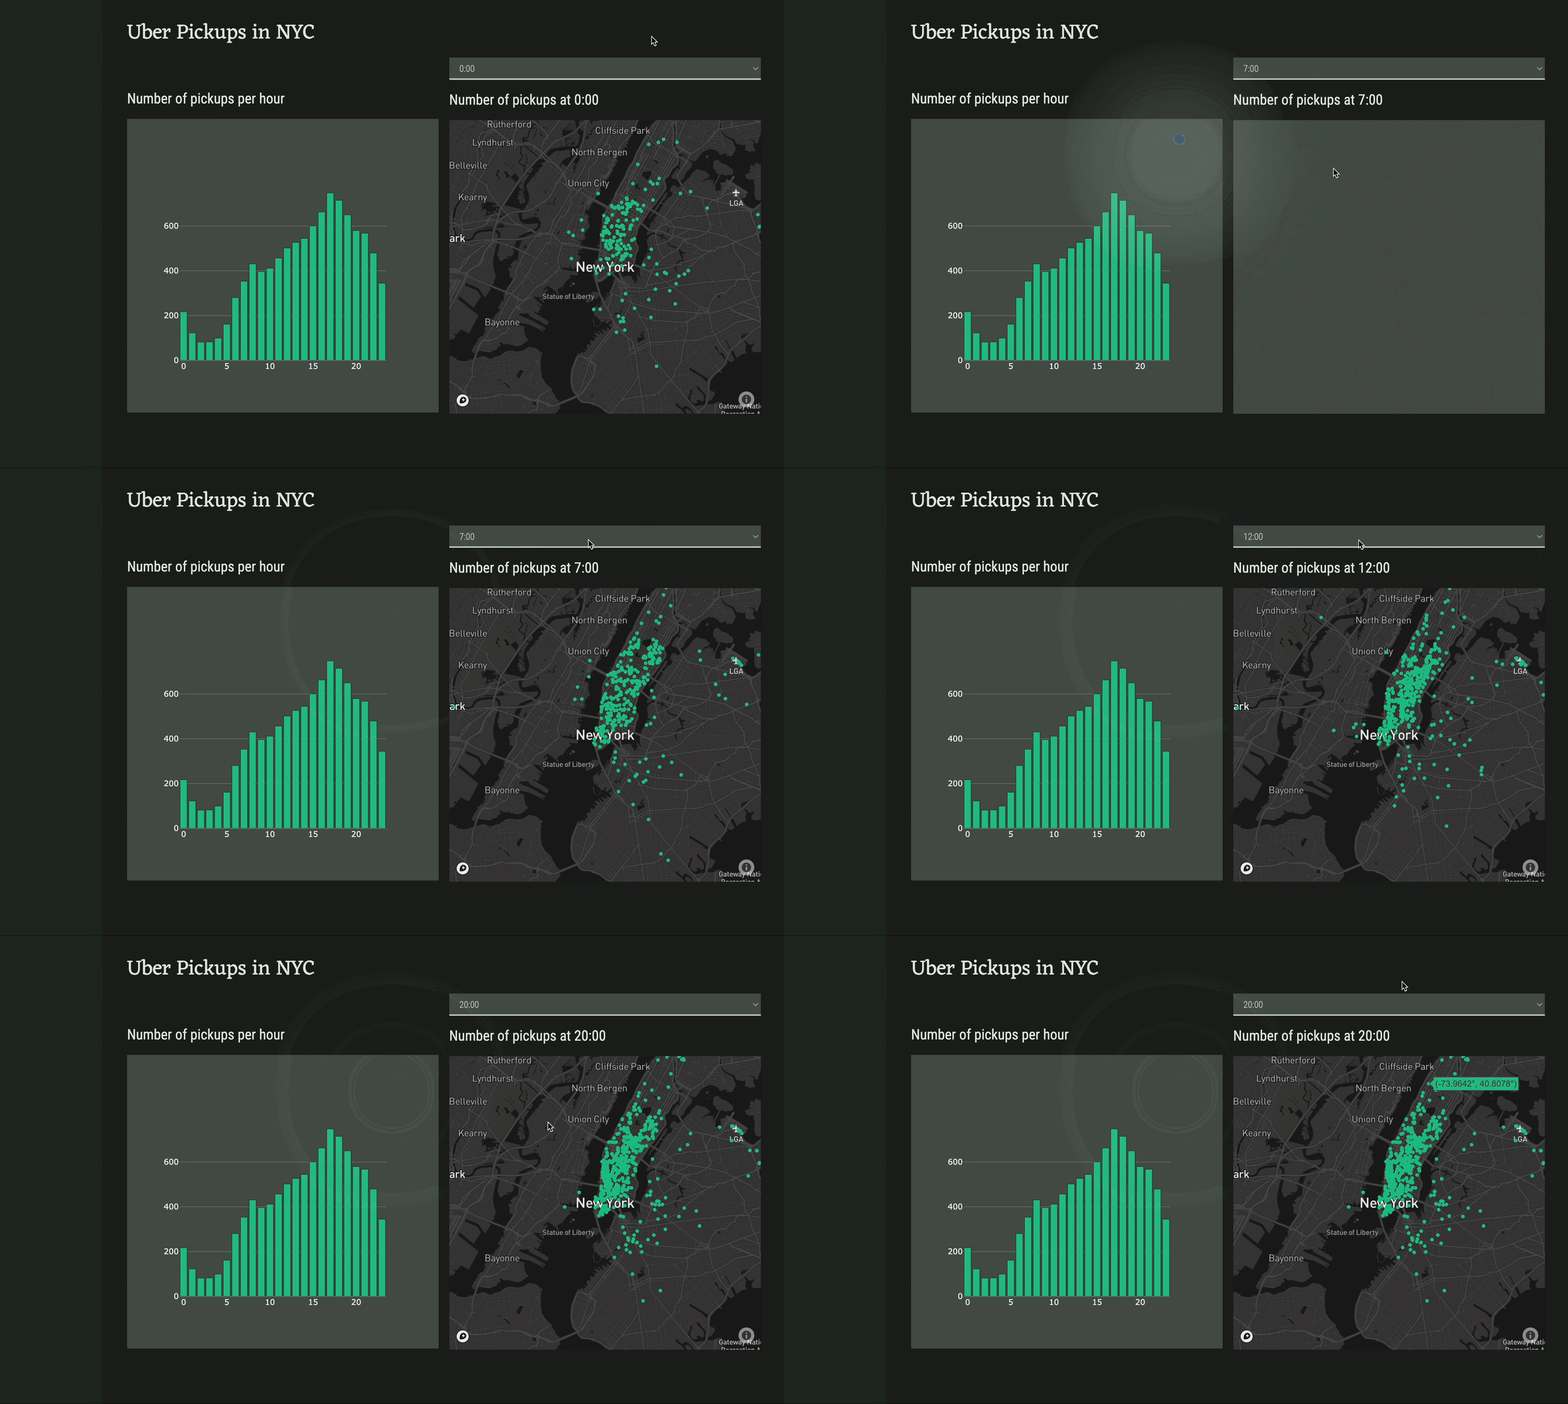
The last thing we need to do is make our dashboard respond to user input. We’ll modify our app so that users can choose an hour from the dropdown menu to filter and reload the map data.
Step 1: Populate the dropdown menu
First, we need to set the items property of the dropdown menu to be a list of all the hours in a day. We can actually set it to be a list of tuples where the first value of the tuple is what is displayed in the dropdown and the second value is the return value when that item is selected:
self.hour_dropdown.items = [(f'{n}:00',n) for n in range(0,24)]Step 2: Set up an event handler
We now want to set up a function that is called when a value is selected from the dropdown menu. Switch to the Design view of the Form and select the dropdown. Scroll to the bottom of the Properties Panel and click the arrows next to change under Events.
This will open the Code view and create a function that will run when the selected_value of self.hour_dropdown changes. When this function is called, we want to reload the map data and set the text property of the self.mapbox_title Label to reflect the data we’re viewing:
def hour_dropdown_change(self, **event_args):
  """This method is called when an item is selected"""
  time = self.hour_dropdown.selected_value
  self.mapbox_title.text = f'Number of pickups at {time}:00'
self.mapbox_map.data = anvil.server.call('get_map_data', time)Step 3: Initialise the dropdown and map
We can actually set the selected_value of the dropdown and run the function from Step 2 when the app loads.
In the Form’s __init__, set the dropdown’s value and replace self.mapbox_map.data = anvil.server.call('get_map_data') with a call to the function we just wrote. The __init__ function should now look something like this:
class Form1(Form1Template):
  def __init__(self, **properties):
    # Set Form properties and Data Bindings.
    self.init_components(**properties)
    Plot.templates.default = 'rally'

    #create the histogram of uber pickups per hour
    self.bar_chart.data = go.Bar(y=anvil.server.call('create_histogram'))

    #initialise the dropdown and map
    self.hour_dropdown.items = [(f'{n}:00',n) for n in range(0,24)]
    self.hour_dropdown.selected_value = 0
    #call the function we just wrote
    self.hour_dropdown_change()

    #add the access token and center the map on NYC
    token = "<your-token-here>"
    self.mapbox_map.layout.mapbox = dict(accesstoken=token, center=dict(lat=40.7128, lon=-74.0060), zoom=10)
    self.mapbox_map.layout.margin = dict(t=0, b=0, l=0, r=0)
We can now test out our app. Run the app and choose a different value in the dropdown menu. Make sure the map changes as well.

Our dashboard is finished! The last thing left to do is to deploy it to the web.
 By
By