 By
By Chapter 3:
Plot data from a Data Table
In this chapter, we’ll use Data Tables to store revenue data, and we’ll display it in our dashboard.
Data Tables are an out-of-the-box option for data storage in Anvil, and they’re backed by PostgreSQL.
Step 1: Add the Data Tables service
In the panel on the left (the App Browser), click the ‘+’ next to ‘Services’, then click on Data Tables.
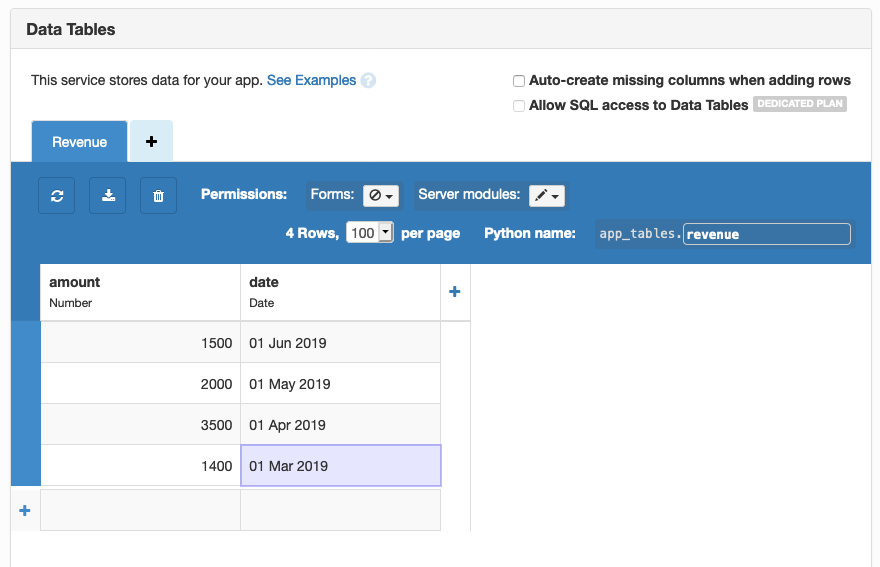
Step 2: Set up a Revenue table
Now set up a table named “Revenue”, with the following columns:
amount(Number column)date(Date column)
Here’s how to do that:
Click ‘Add a table’ in the light blue box at the top, then ‘Create new table…’. You’ll be prompted to give your table a name - let’s call it ‘Revenue’.
Next, add a column for the revenue amount, by clicking ‘+ New Column’ and choosing ‘Add Number column…’. Call this column ‘amount’.
Keep adding columns until your Data Table has the structure we described above. Column titles are case sensitive, so let’s stick to lower case.

Adding columns to the Revenue table
Double click the cells to add some revenue data to your table - it should look something like this:
Step 3: Access the data in a Server Module
Anvil’s Server Modules are a full server-side Python environment. Server Modules cannot be edited or seen by the user, so we can trust them to do what we tell them. This is why we’ll use a Server Module to access the Data Table we just created.
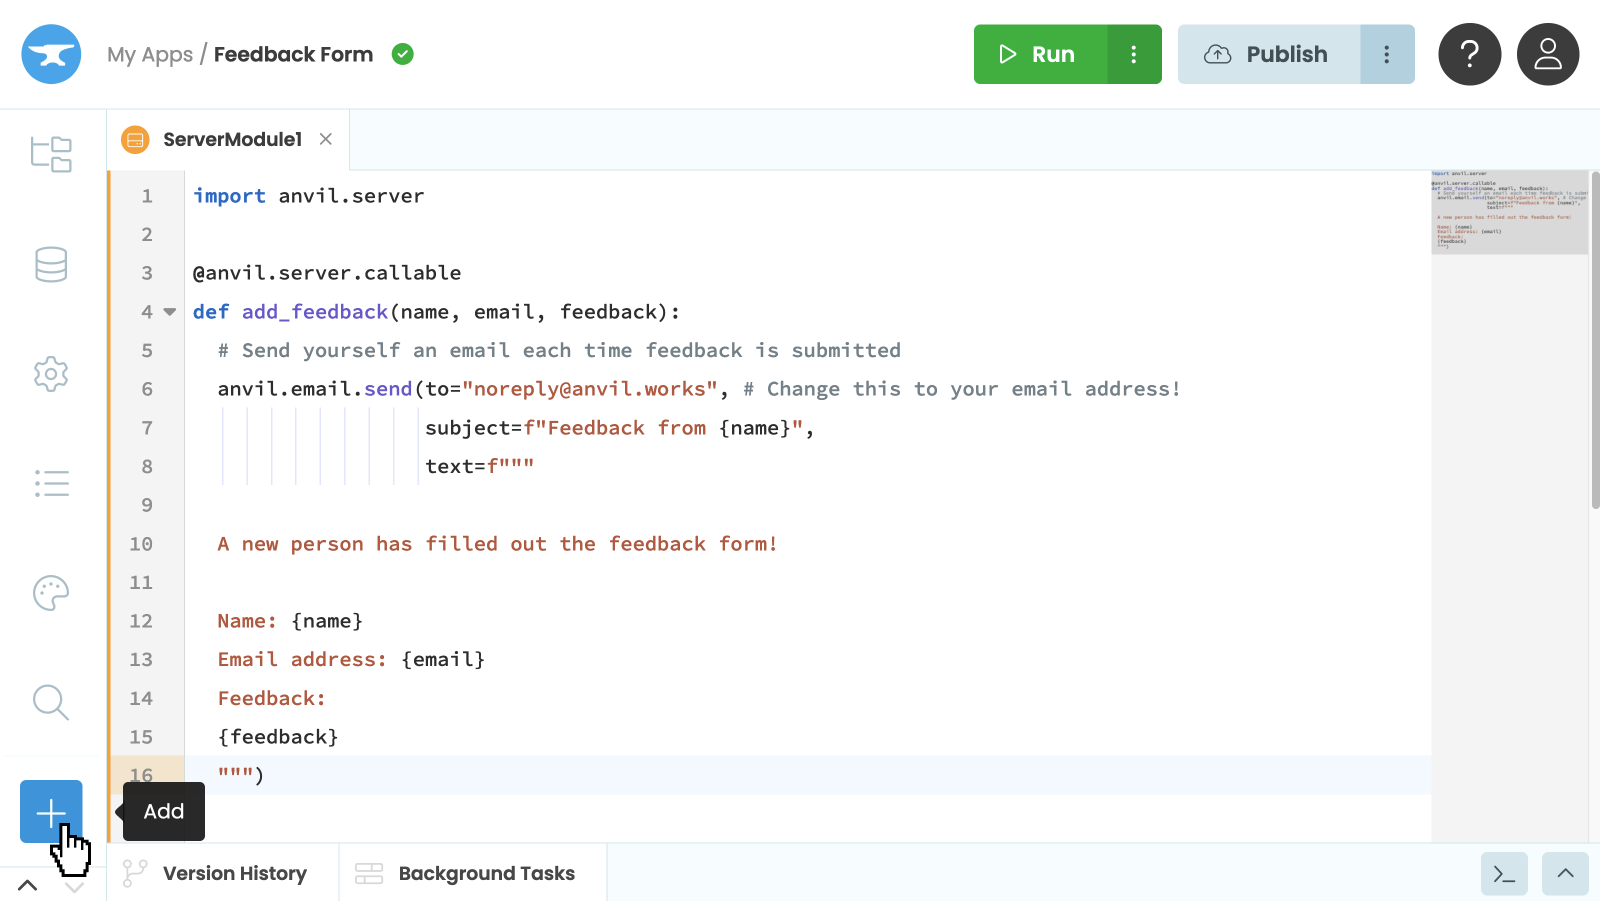
Create a Server Module by clicking the ‘+’ next to Server Code in the App Browser. You’ll see some code with a yellow background:

We’ll write a server function that requests data from the ‘Revenue’ data table we just created. We’ll use the search() method to do this.
Add this function to your Server Module:
@anvil.server.callable
def get_revenue():
  return app_tables.revenue.search()
The @anvil.server.callable decorator allows us to call this function from client code.
That means we have a function we can call from the browser to securely access data from the ‘Revenue’ Data Table. We’ll plot this data in the next step.
Step 4: Plot the data
We want to call our get_revenue server function when the app is opened. We made our get_revenue server function available to our client-side code by decorating it as @anvil.server.callable.
This means we can call it from our client-side code using anvil.server.call('get_revenue')
Go back to Form1 and change your build_revenue_graph function to look like this:
  def build_revenue_graph(self):
    # Get the data from our server function, and store it as 'db_data'
    db_data = anvil.server.call('get_revenue')

    # Create a Bar plot with this data, and change the colour of the markers
    self.plot_1.data = go.Bar(
      x = [x['date'] for x in db_data],
      y = [x['amount'] for x in db_data],
      marker=dict(color='#2196f3')
)Step 5: Run your app
Click the Run button, and you’ll see that your bar graph is now being populated with data from Anvil’s database. Great job!
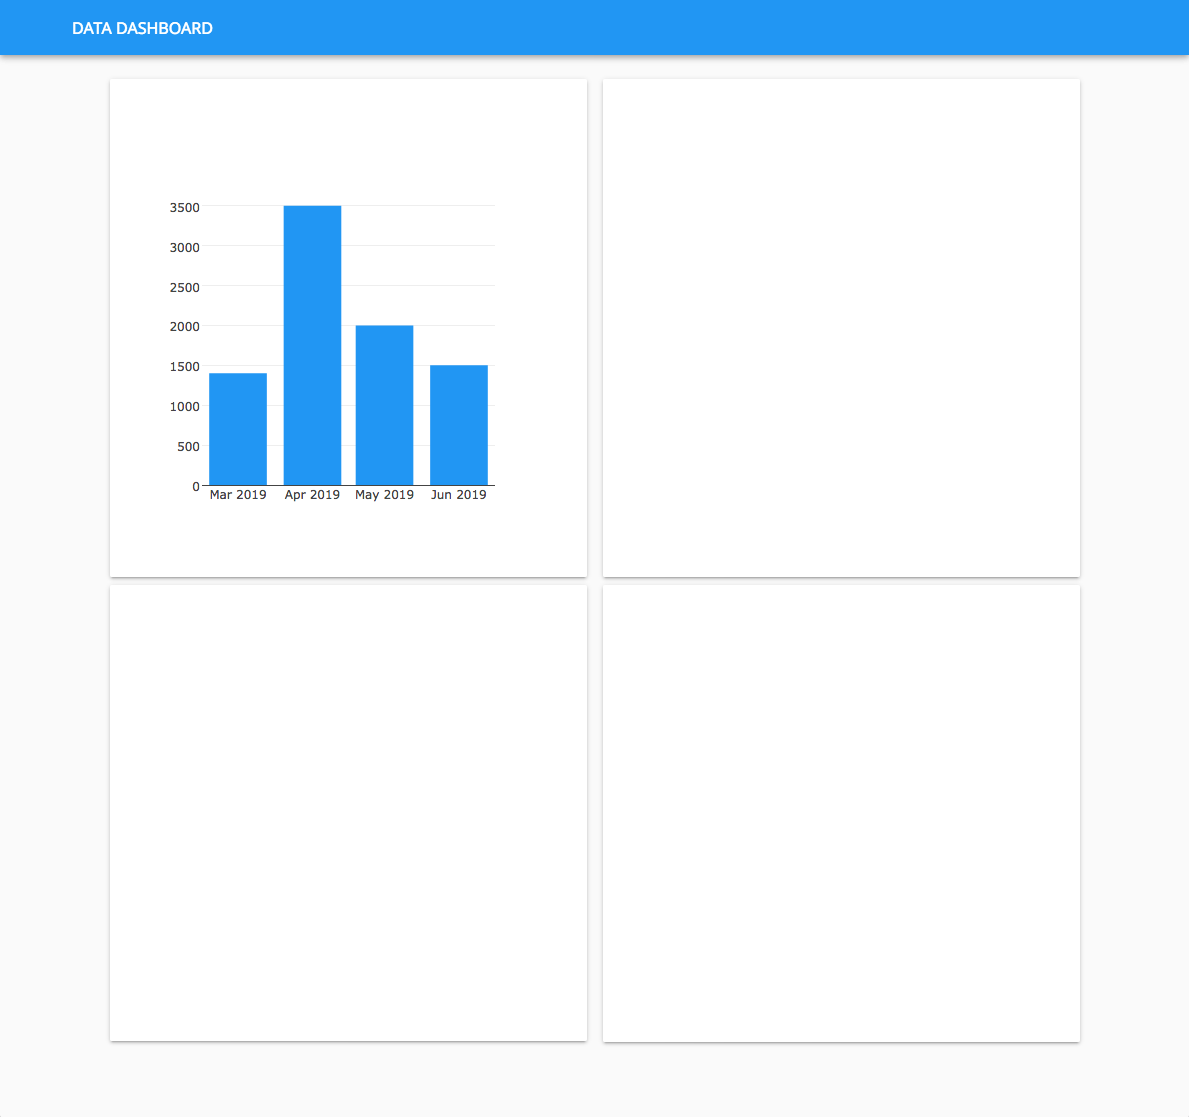
Instead of hard-coded data, this plot now pulls data from a database at runtime.
That’s the first plot done - we’ve plotted data from Anvil’s built-in database.
Next, we’ll populate the other three plots with data from external sources.
We’ll start with data from an external SQL database (PostgreSQL in this example.)