 By
By Chapter 1:
Build your user interface
To start off, we’ll build a user interface using Anvil’s drag-and-drop editor.
Step 1: Create an app
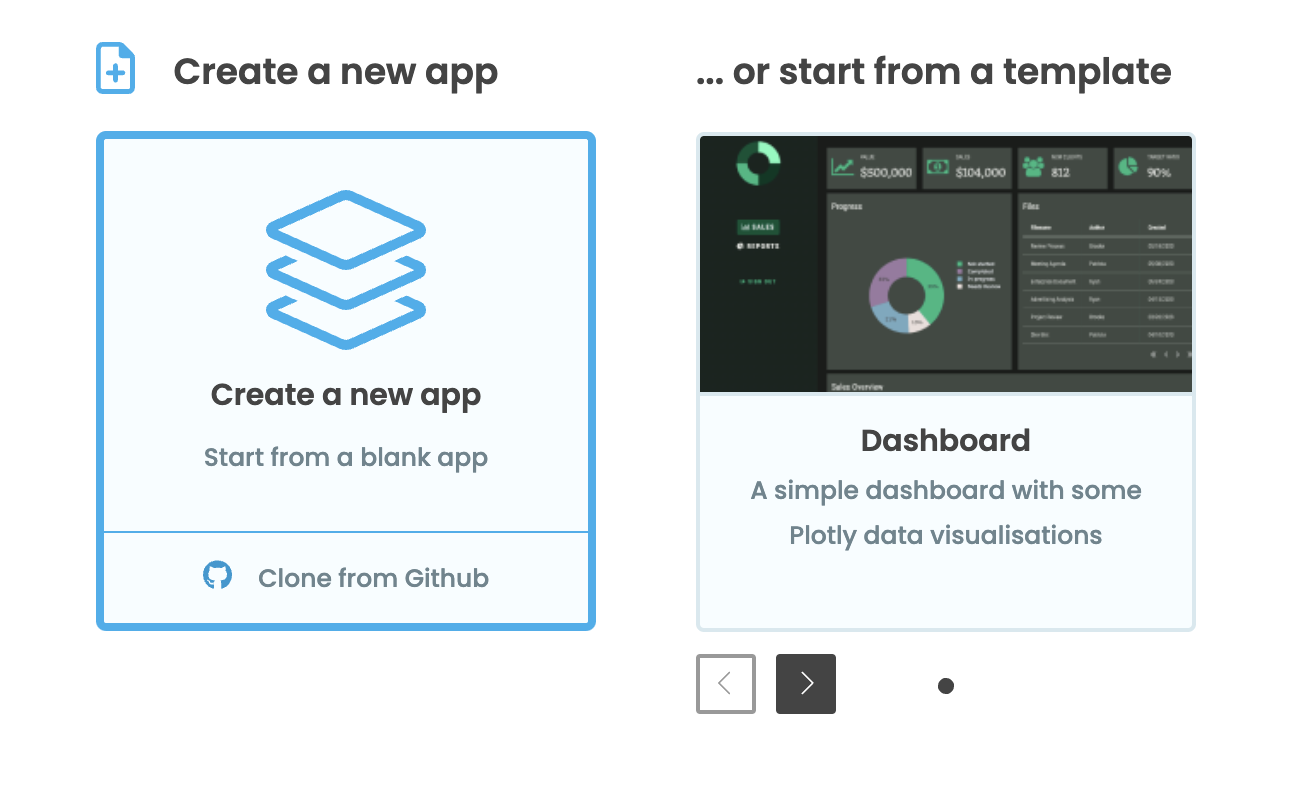
Log in to Anvil and click ‘New Blank App’. Choose the Material Design theme.
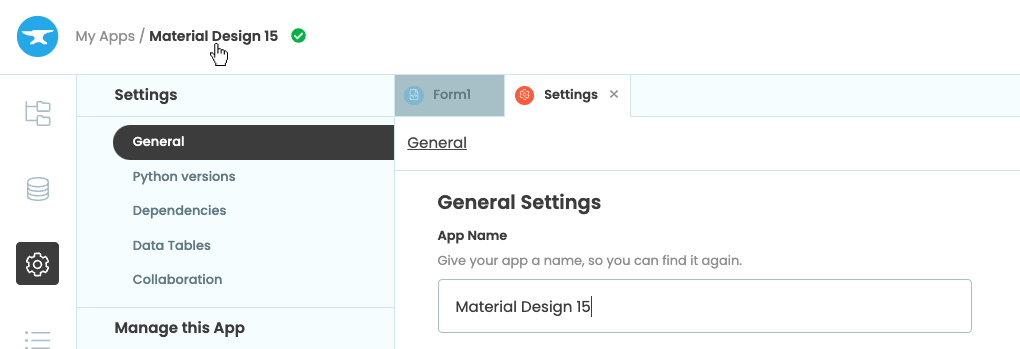
First, name the app. Click on the name at the top of the screen and give it a name.
Step 2: Add components
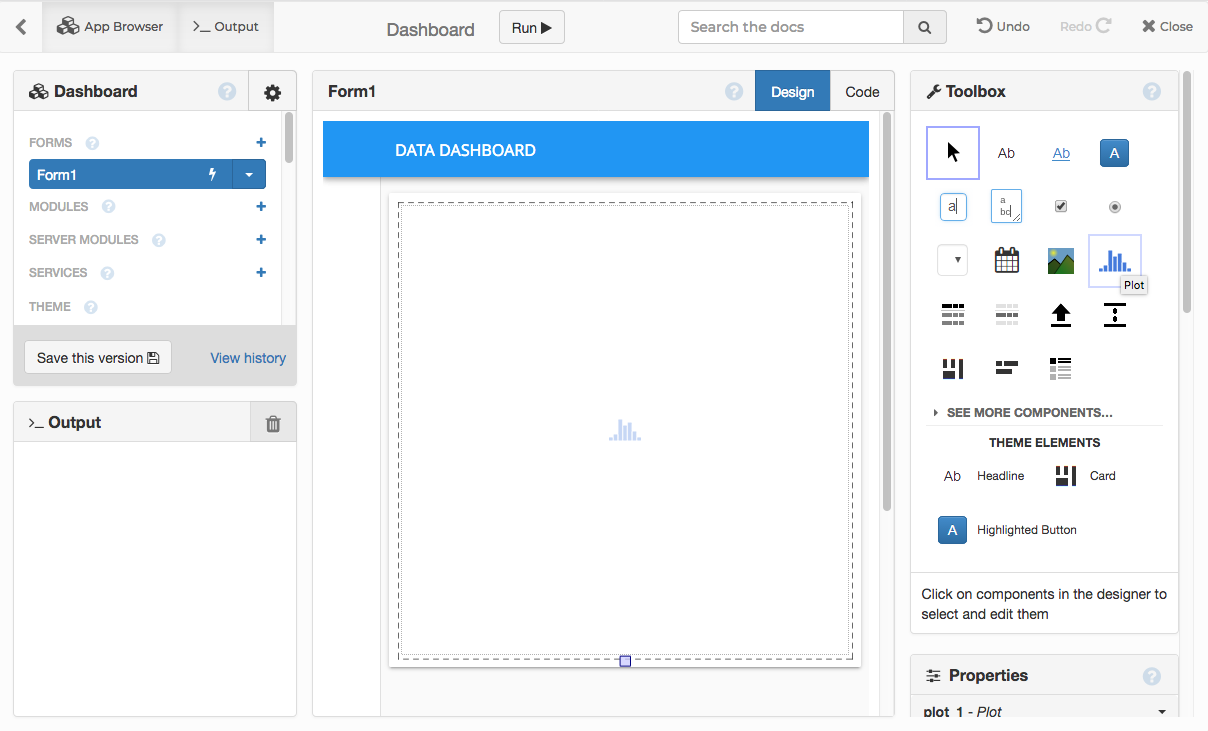
We construct the UI by dragging-and-dropping components from the Toolbox into the page.
Drop a Label ![]() into the blue bar at the top, where it says ‘Drop title here’.
into the blue bar at the top, where it says ‘Drop title here’.

Step 3: Change component properties
Below the Toolbox, you’ll see the Properties Panel, where you edit the styling and behaviour of your components.
Select the Label you just added to the page, and change the text to ‘DATA DASHBOARD’.

Step 4: Add your first Plot
Let’s add your first Plot - we’ll put it inside a container component called a Card.
The Theme Elements part of the Toolbox contains components that are specific to the current app’s Theme. Here, you’ll find the Card component:
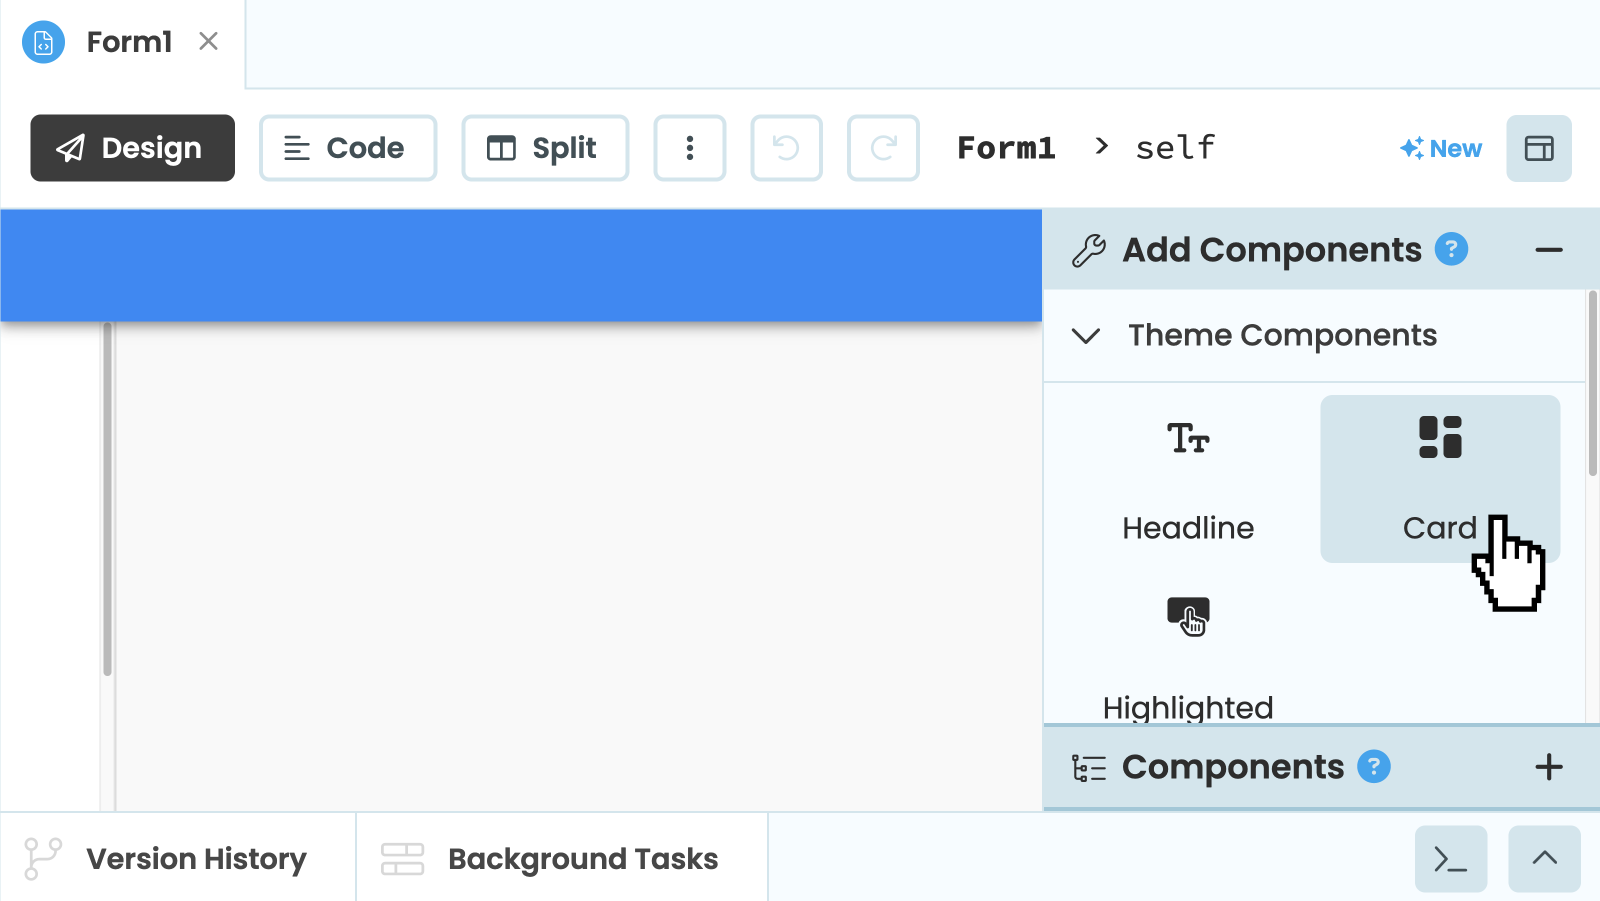
Drop a Card  into the page. In the Properties panel on the right hand side, click the ‘MORE’ button to the right of ‘Container Properties’, and select
 full_width_row. This will make your Card stretch to fill the width of the page.

Next, drop a Plot ![]() component inside the Card.
component inside the Card.
Step 5: Add three more plots
Drop three more Cards and Plots to your app in a 2 x 2 grid-style layout, and make sure all of your cards have the full_width_row property checked. You can resize your plots by dragging the resizer (Ctrl+drag for finer adjustments).

We’ve built a basic UI. Nice job! Time for Chapter 2.