 By
By Chapter 5:
Plot data from a private database
We’ve seen how to plot data from an external SQL database.
Next, we’ll plot data from a private SQL database (a database that can’t be accessed directly from Anvil’s servers – for example, a database on your corporate network.)
Step 1: Connect your machine
Let’s imagine we’ve been testing some marketing strategies, and we’ve collected data on the number of visits to our page for each strategy. But this data is held in a private SQL database that can only be accessed from within our company network.
We’ll use the Anvil Uplink as a gateway to give our app access to this data.
Connect your own machine to your Anvil app
The Anvil Uplink allows you to connect code running anywhere to your Anvil app. You can write code to query your private database, run it inside your company network, then use the Uplink to connect to your app – so now you can run your query from the cloud!
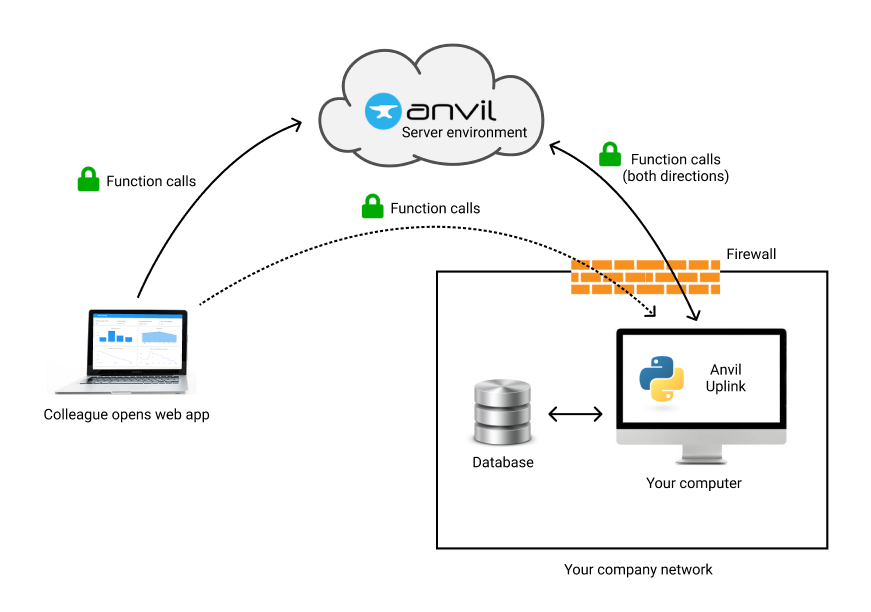
An Uplink script can run on any machine, and connects back to your Anvil app using a secure websocket connection.
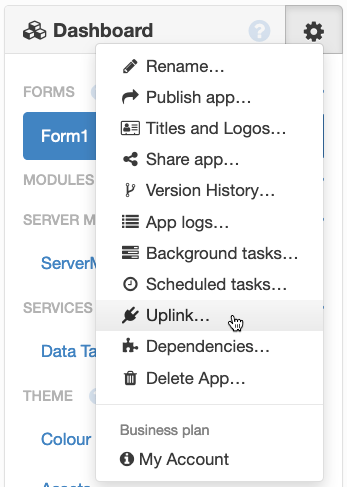
Let’s set it up. Start by selecting the Anvil Uplink in your app menu.
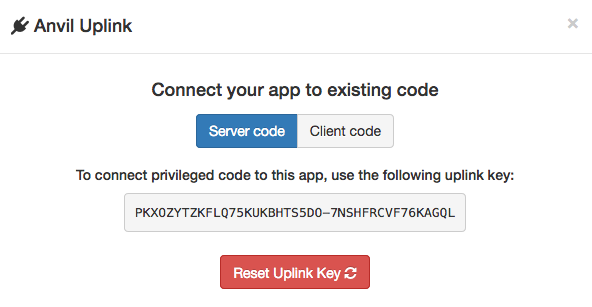
Click the green ‘Enable the Anvil Server Uplink for this app’ button, and you’ll see an authentication key that you can use to connect code running elsewhere to your Anvil app:
To use the Anvil uplink library in your Python project, first run pip install anvil-uplink on your machine.
Then create a file called my_uplink_script.py containing these lines:
import anvil.server
anvil.server.connect('your-uplink-key')

anvil.server.wait_forever()
(Remember to replace 'your-uplink-key' with the Uplink key for your app!)
Run the script (type python or python3 followed by my_uplink_script.py in a Terminal window). You’ll see the following lines in your Terminal window if the connection has been successful:
Connecting to wss://anvil.works/uplink
Anvil websocket open
Connected to "Default environment (dev)" as SERVER
That’s all you need to do to connect your machine to your Anvil app.
Step 2: Get the data
Now that we’ve connected our app to our local machine, we can write a function to return data to be plotted in our dashboard.
In your uplink script, define a function called get_marketing_data, and decorate it with @anvil.server.callable to make it available inside your Anvil app. We’ll start by making it return some test data:
@anvil.server.callable
def get_marketing_data():
    # access data on your local machine and return as a Python list
    return [{'strategy':'Strategy A', 'count':200},
            {'strategy':'Strategy B', 'count':185},
            {'strategy':'Strategy C', 'count':175}]
(Note: Insert this function before the call to anvil.server.wait_forever(), or the server function will never be registered!)
Stop and re-run your script to apply this change.
If you have local PostgreSQL database you wish to connect to, you can connect to it in this function in the same way that we did in Step 1.
Step 3: Plot the data
All that’s left is to display this data in our dashboard. We’ll call the get_marketing_data function from client code
and put the data into a plot just as we did in Chapter 3.
Go to Form1’s ‘Code’ view and add this function:
  def build_marketing_graph(self):
    # We’re calling a function on your local machine from the web!
    # Get the data and store it as 'marketing_data'
    marketing_data = anvil.server.call('get_marketing_data')
    # Create a Line plot with this data, and change the colour of the line
    self.plot_3.data = go.Scatter(x = [x['strategy'] for x in marketing_data],
                                  y = [x['count'] for x in marketing_data],
                                  mode='lines+markers',
                                  line=dict(color='#2196f3'))
We want to plot this data when our app runs, so let’s call it from the __init__ method of Form1:
self.build_marketing_graph()Run your app
Click run and you’ll see we’ve populated three of our four graphs. Excellent work!
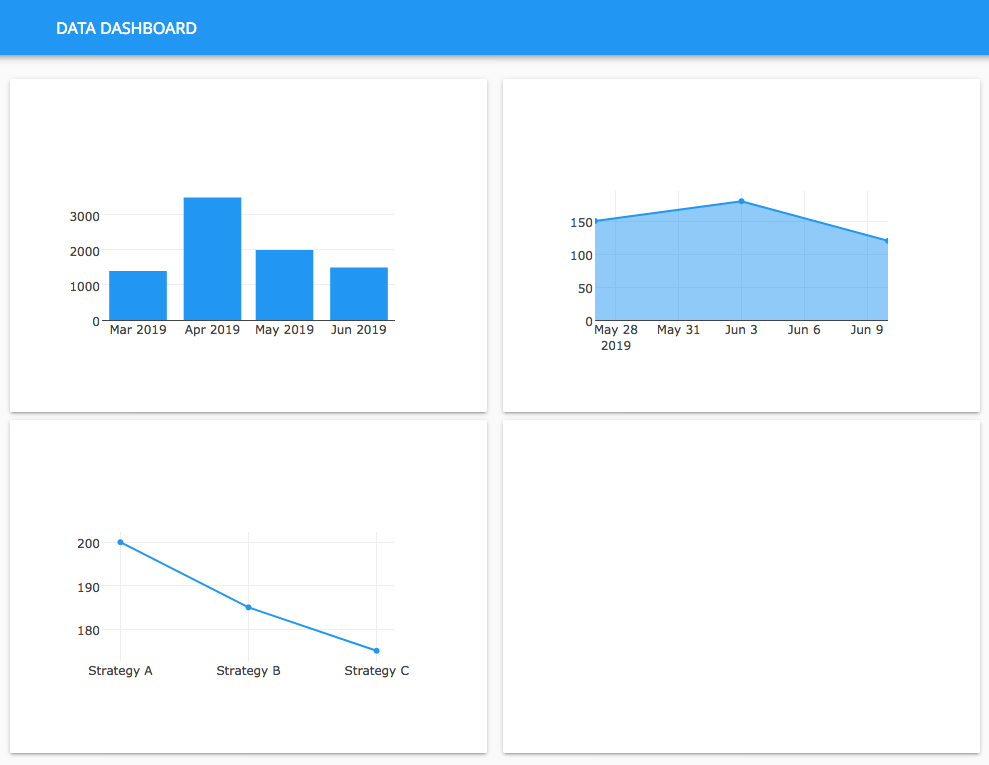
We’ve populated three of our four graphs. Excellent work!
Next, we’ll plot data from a REST API.