 By
By Chapter 2:
Write client-side Python
Time to create our first plot. We’ll display a bar chart by writing client-side Python code that runs in the browser.
Step 1: Go to the Code view
Go to ‘Code’ view in the Form Editor:

This is where you write your client-side Python code that runs in the browser.
Step 2: Plot some data
We’ll use Plotly to create our plots. You’ll notice that Plotly is already imported at the top of Form1:
import plotly.graph_objects as goLet’s write a Python function to plot our first bar chart.
Add a build_revenue_graph function to your client-side code:
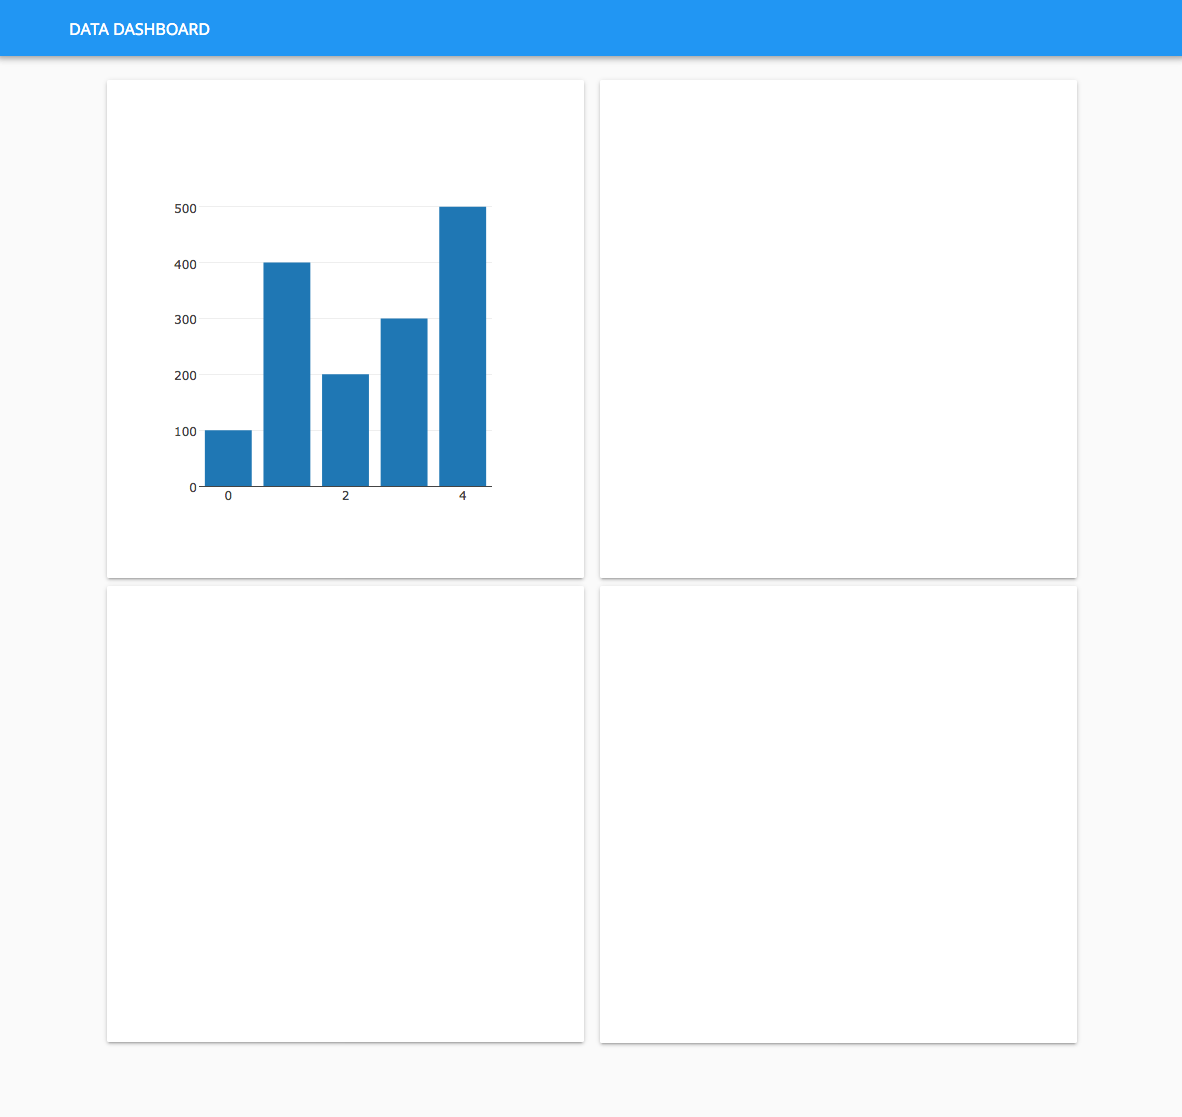
  def build_revenue_graph(self):
    self.plot_1.data = go.Bar(y=[100,400,200,300,500])
We want to build this graph when our app first opens, so add this line to the the __init__ method of your form:
  # Any code you write here will run before the form opens.
  self.build_revenue_graph()
Your ‘Form1’ should now look like this:
from ._anvil_designer import Form1Template
from anvil import *
import plotly.graph_objects as go

class Form1(Form1Template):

  def __init__(self, **properties):
    # Set Form properties and Data Bindings.
    self.init_components(**properties)

    # Any code you write here will run before the form opens.
    self.build_revenue_graph()

  def build_revenue_graph(self):
self.plot_1.data = go.Bar(y=[100,400,200,300,500])Step 3: Run your app
To see it in action, click the ‘Run’ button at the top of the screen:

You’ll see your app running, and that you’ve plotted your first Bar Chart.
We’ve displayed data in our first plot, we’re off to a good start! Next, we’ll modify it to plot data from Anvil’s built-in database.
In Chapter 3, we’ll create the database table.