
 By
By Chapter 2:
Build the UI to display your transactions
Now we’ll build the main form of our app. It will display all the transactions from our Google Sheet in a table.
We’ll make it work by writing some more client-side Python code that runs in the browser.
Step 1: Add a title
First, let’s give the app a title. Drag a new Label on to the Drop Title Here area in the Form Editor. Give it the text My Finance Tracker.
Step 2: Add a Data Grid
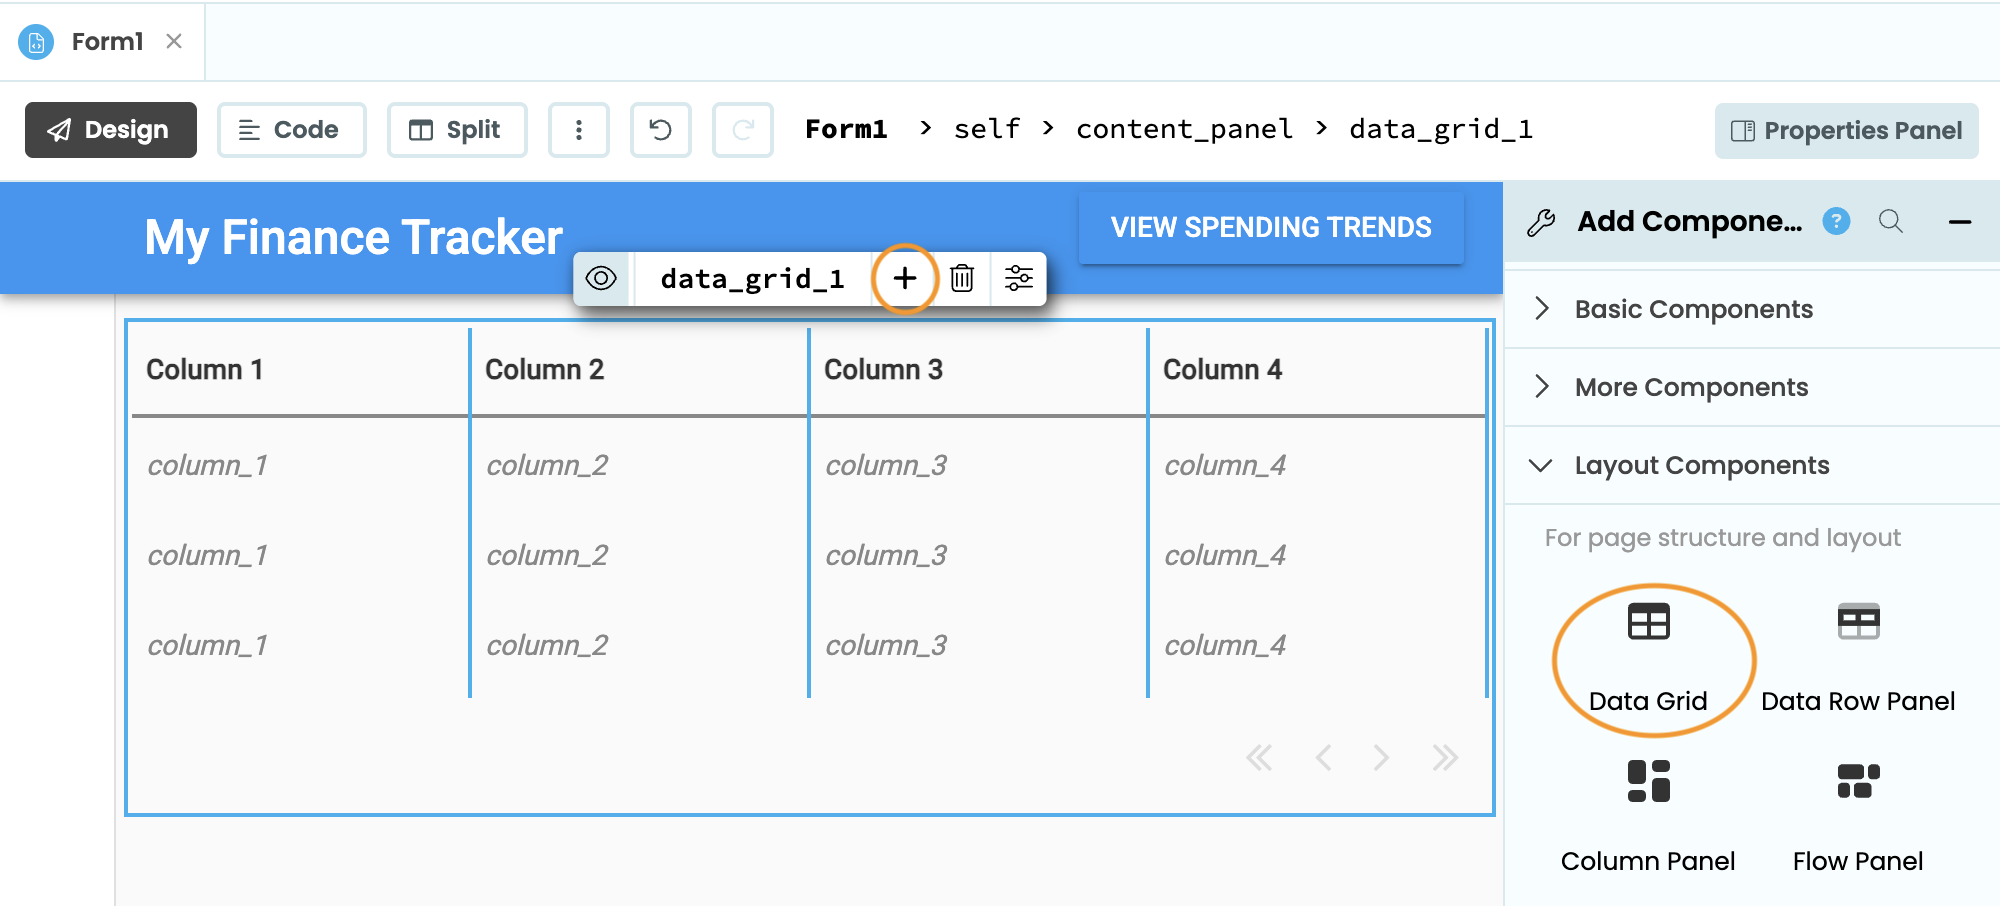
Drag-and-drop a Data Grid ![]() onto the Form. A Data Grid displays data in rows and columns, which makes it a good fit for our transactions display.
onto the Form. A Data Grid displays data in rows and columns, which makes it a good fit for our transactions display.
Create a fourth column by clicking the + sign next to the Data Grid name.
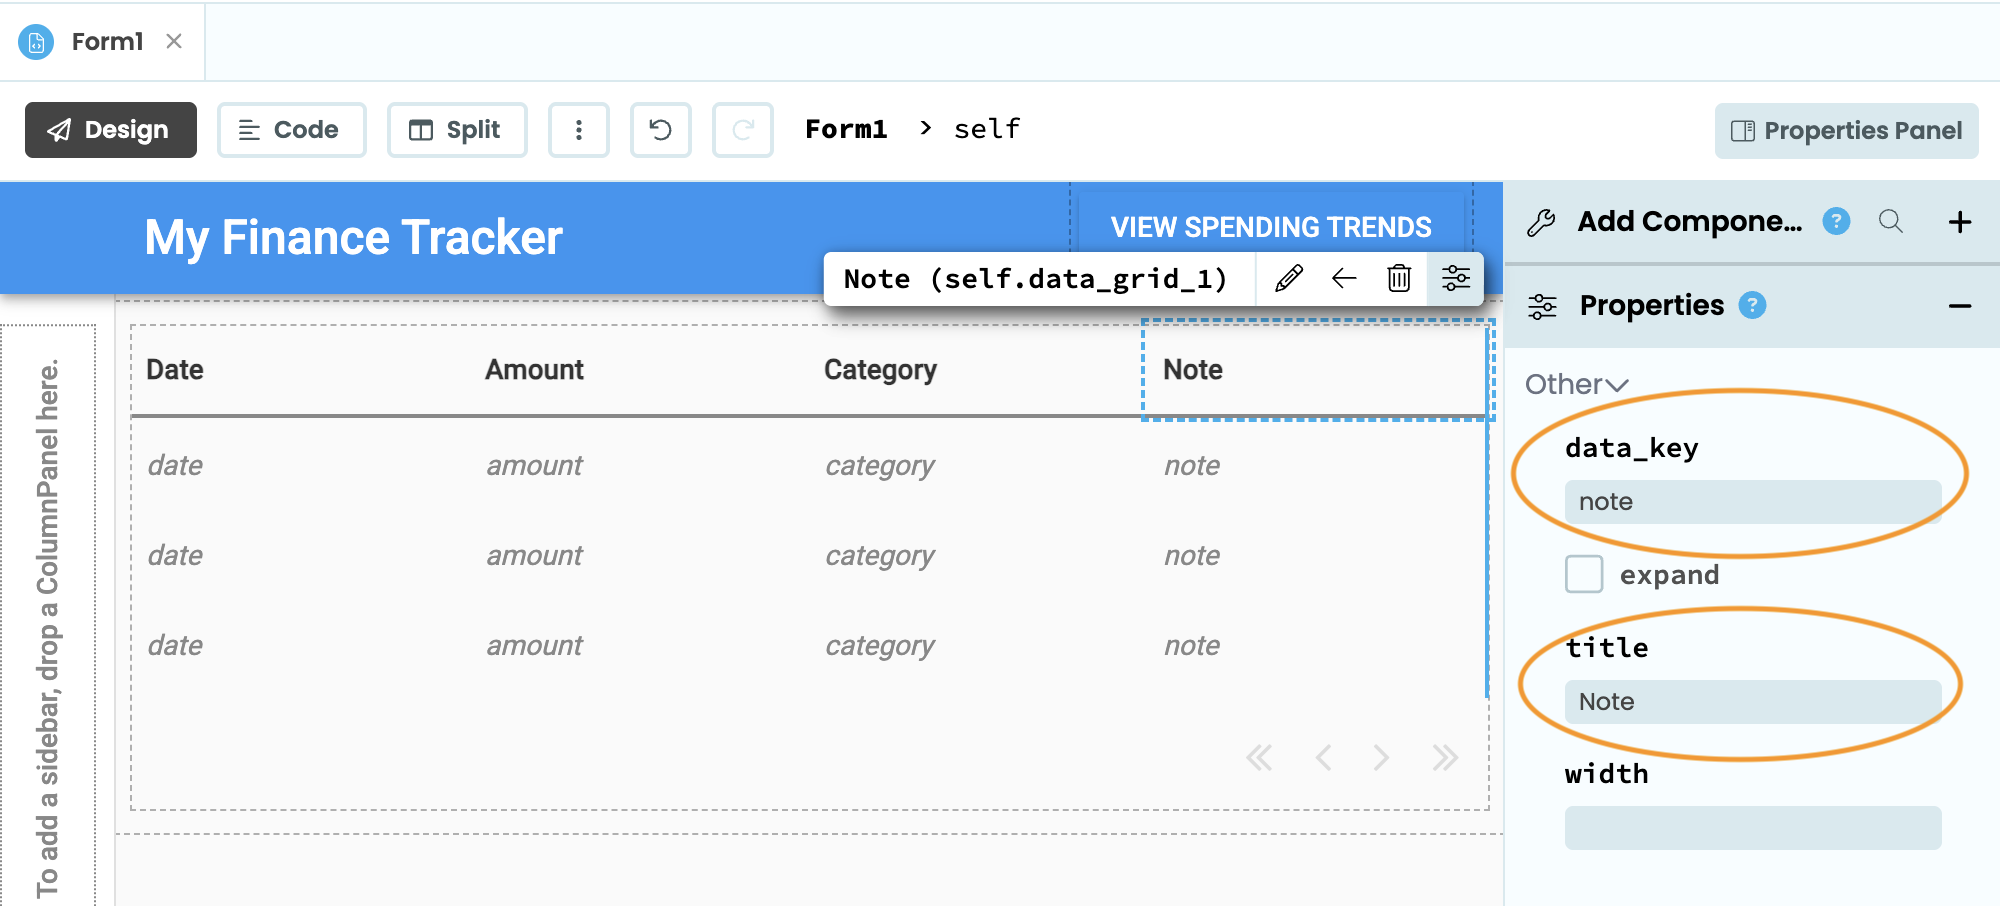
For each column, set the title and data key to the following in the Properties Panel:
- title:
Date, data_key:date - title:
Amount, data_key:amount - title:
Category, data_key:category - title:
Note, data_key:note
Step 3: Populate the Data Grid
Go to the Code view of Form1.
When you add a Data Grid to a Form, a Repeating Panel is automatically created inside it. The Repeating Panel is what renders each row and each transaction from the Google Sheet is populated through self.repeating_panel_1.items.
Before we can display the transactions in the Data Grid, the Amount value has to be cast to a float and formatted to two decimal places with the £ sign added in front.
Add a load_transactions function and update your __init__ method to call the new function:
def __init__(self, **properties):
  # ...Existing code
  self.load_transactions()

def load_transactions(self):
  rows = self.worksheet.rows # Get all rows in the Google Sheet

  # Build a list of dictionaries for each transaction, to populate the Data Grid
  self.repeating_panel_1.items = [
    {
      'date': row['Date'],
      'amount': f"£{float(row['Amount']):.2f}",  # Cast to float before formatting
      'category': row['Category'],
      'note': row['Note']
    }
    for row in rows
]Step 4: Try it out
Click Run. You should see all 10 transactions from the Sheet displayed in the Data Grid.
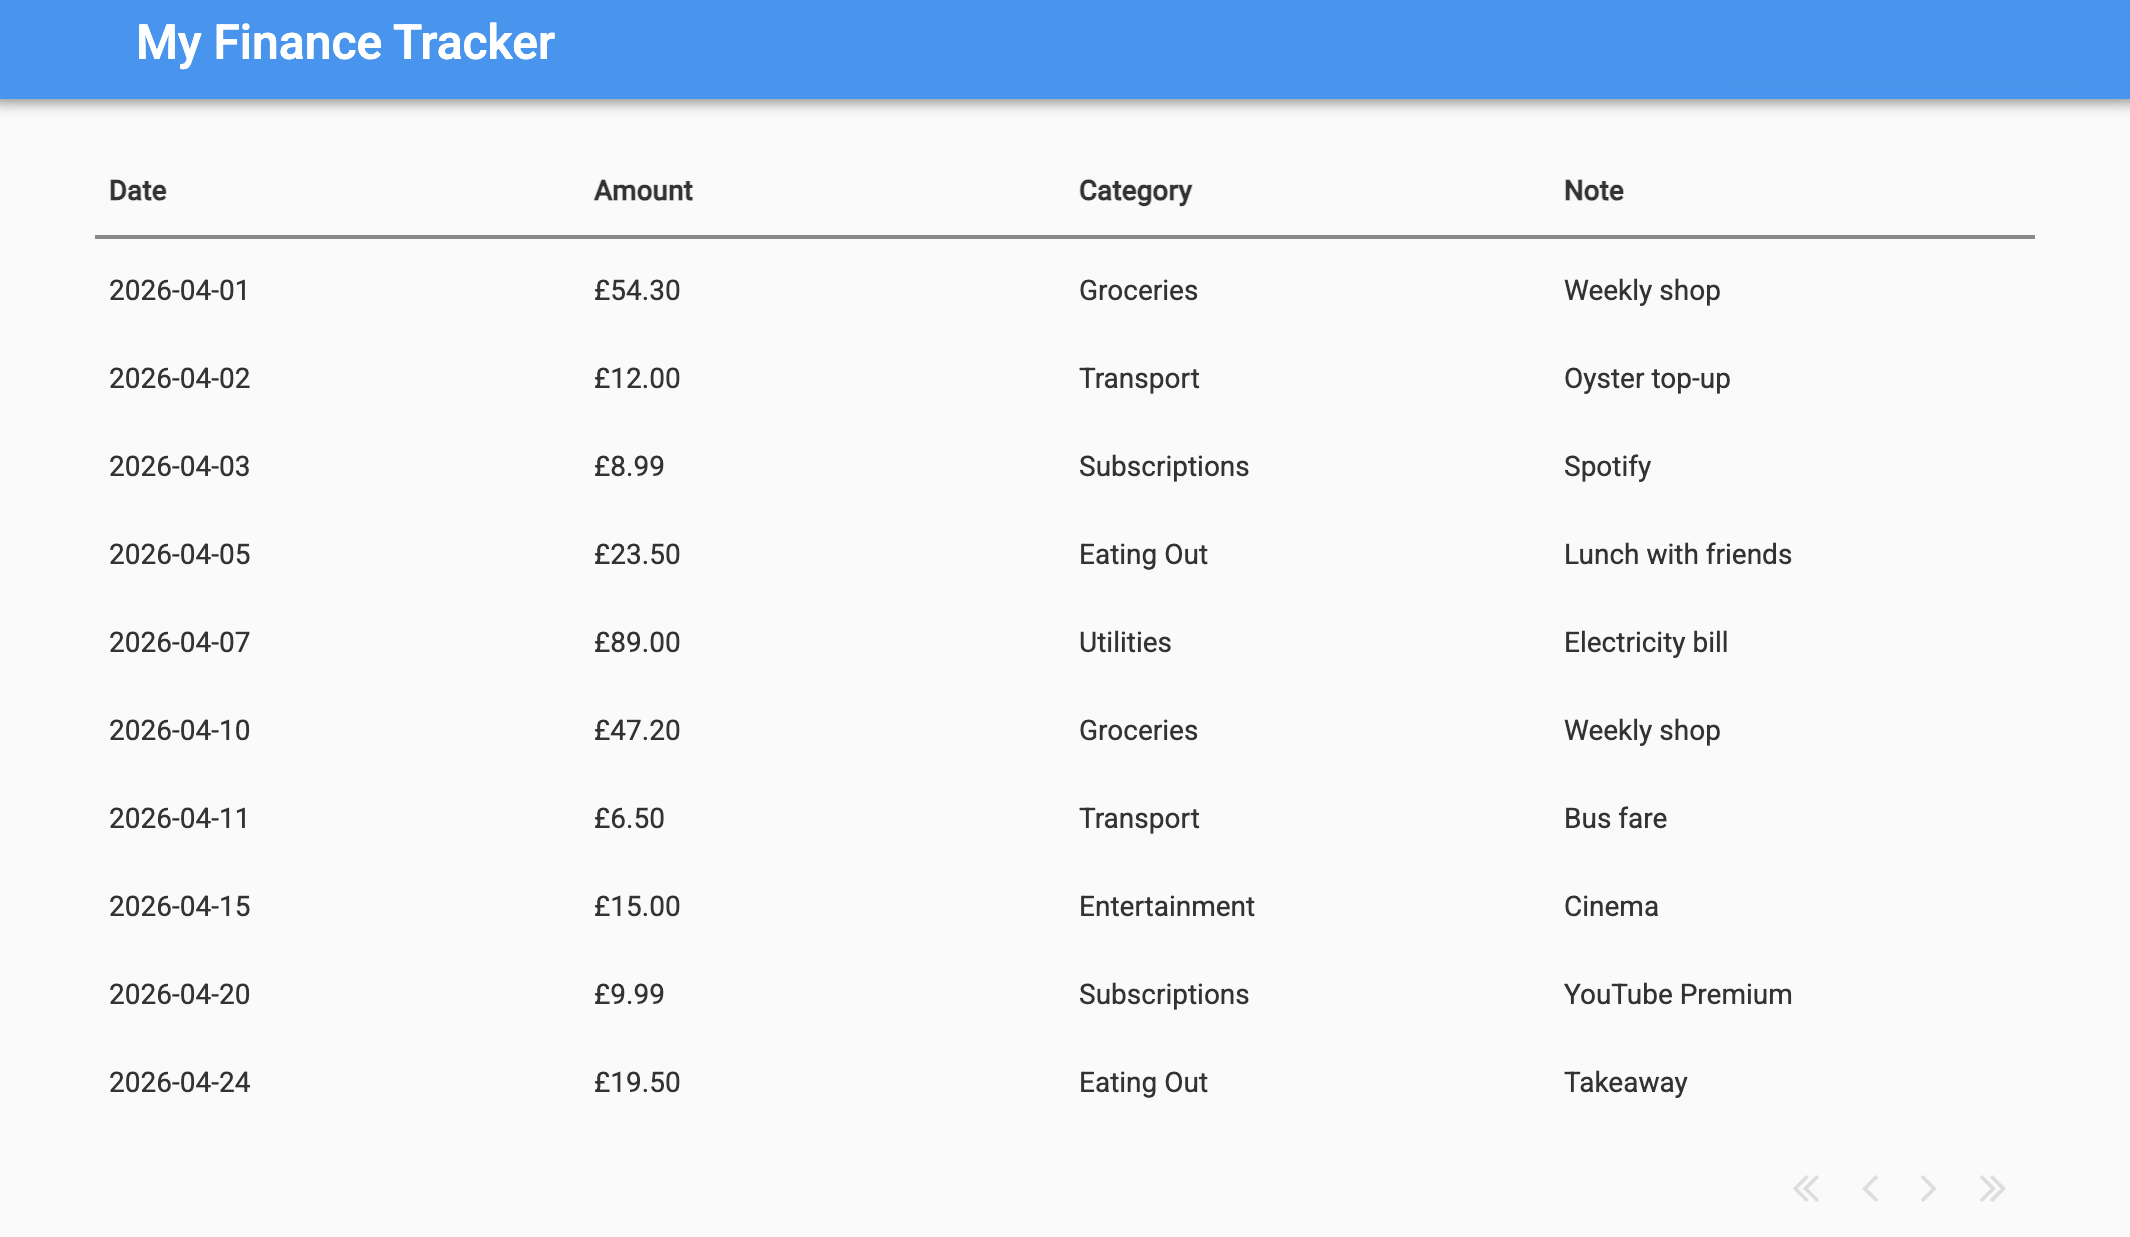
Now we have displayed all of the transactions from the Google Sheet in our app.
In Chapter 3, we’ll add the ability to log a new transaction from the app.