 By
By Chapter 1:
Build your user interface
Creating web apps with Anvil is simple. No need to wrestle with HTML, CSS, JavaScript or PHP. We can do everything in Python.
Step 1: Create your Anvil app
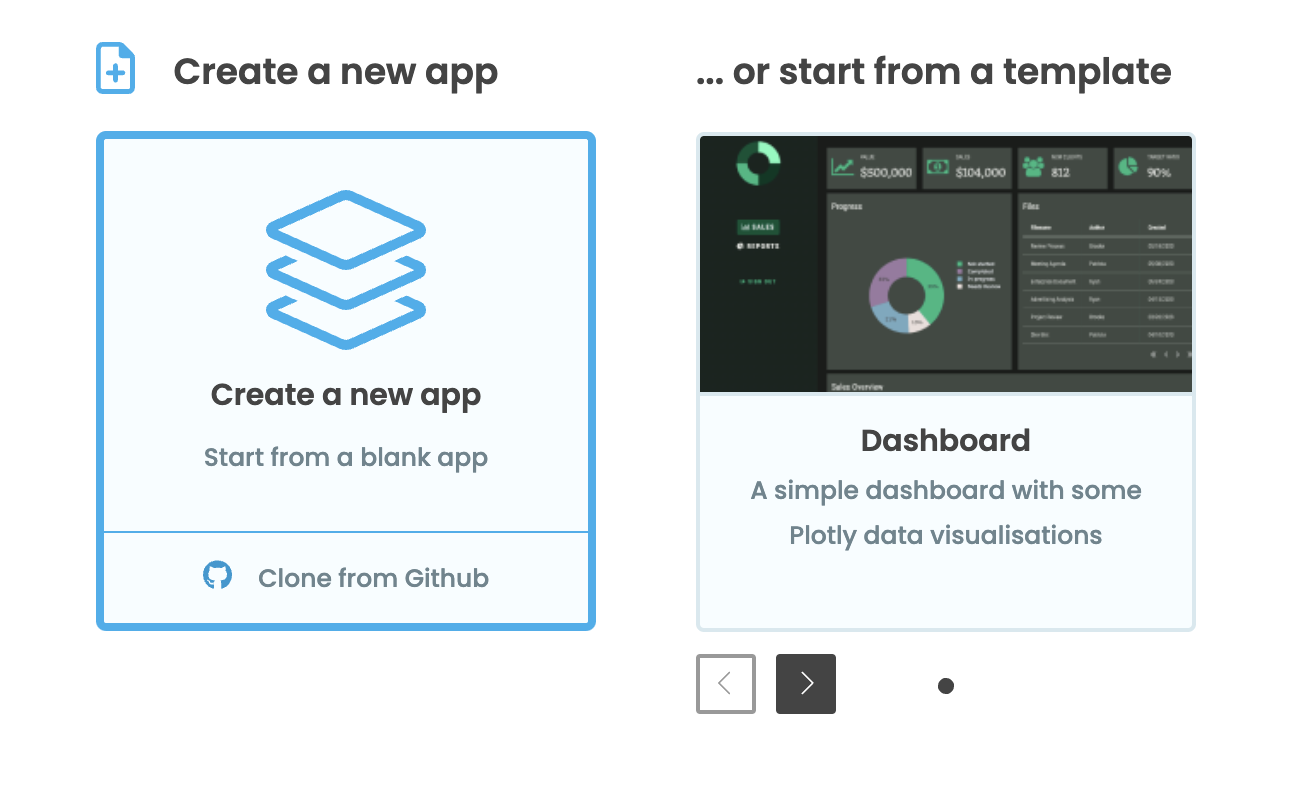
Log in to Anvil and click ‘Create a new app’. Choose the Material Design theme.
First, name the app. Click on the name at the top of the screen and give it a name.
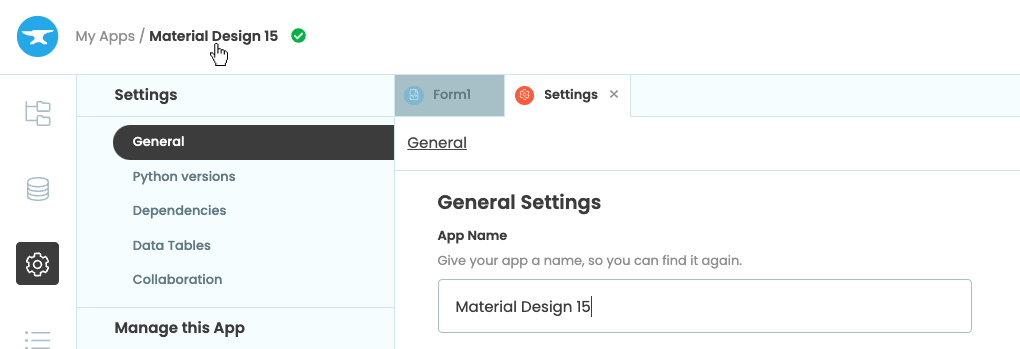
Rename your app by clicking on the title
Step 2: Design your page
To classify the species of iris a flower comes from, we need to collect several measurements, so let’s design the user interface for entering that data.
We construct the UI by dragging-and-dropping components from the Toolbox. Let’s start by dropping a Card  into our form – this will be a neat container for the other components. Then let’s add a Label
 ![]() and a TextBox
and a TextBox ![]() into the card component:
into the card component:
Drag and Drop a Card, Label and TextBox
Next we will set up the Label and TextBox components to collect the sepal length.
Select the Label we just added and, in the Properties Panel on the right, change the text to ‘Sepal length: ’ and align the text to the right.
Then select the TextBox we added and change the name to sepal_length, change the placeholder text to ‘(cm)’ and align the text to the centre.
Change the properties of the Label and TextBox
Repeat this process adding labels and text boxes for the other parameters we need: sepal width, petal length and petal width. This will capture all the information we need to classify each iris flower.
Next, let’s add a Button  to run the classifier. Name it
 categorise_button and change the text to ‘Categorise’. Clicking this button will trigger a Python function to send the iris measurements to our Colab notebook. (We’ll set that up in a moment.)
Add a Button component to our UI
Finally, let’s add a Label where we’ll display our results. Put it below the button, call it species_label, centre the text and click the visible icon on the floating Object Palette, so it doesn’t appear immediately. In step 3 we will create an event handler function that makes the label visible, and uses it to display data returned from our Colab notebook.
Add a Species label to our UI
Our app should now look like this:
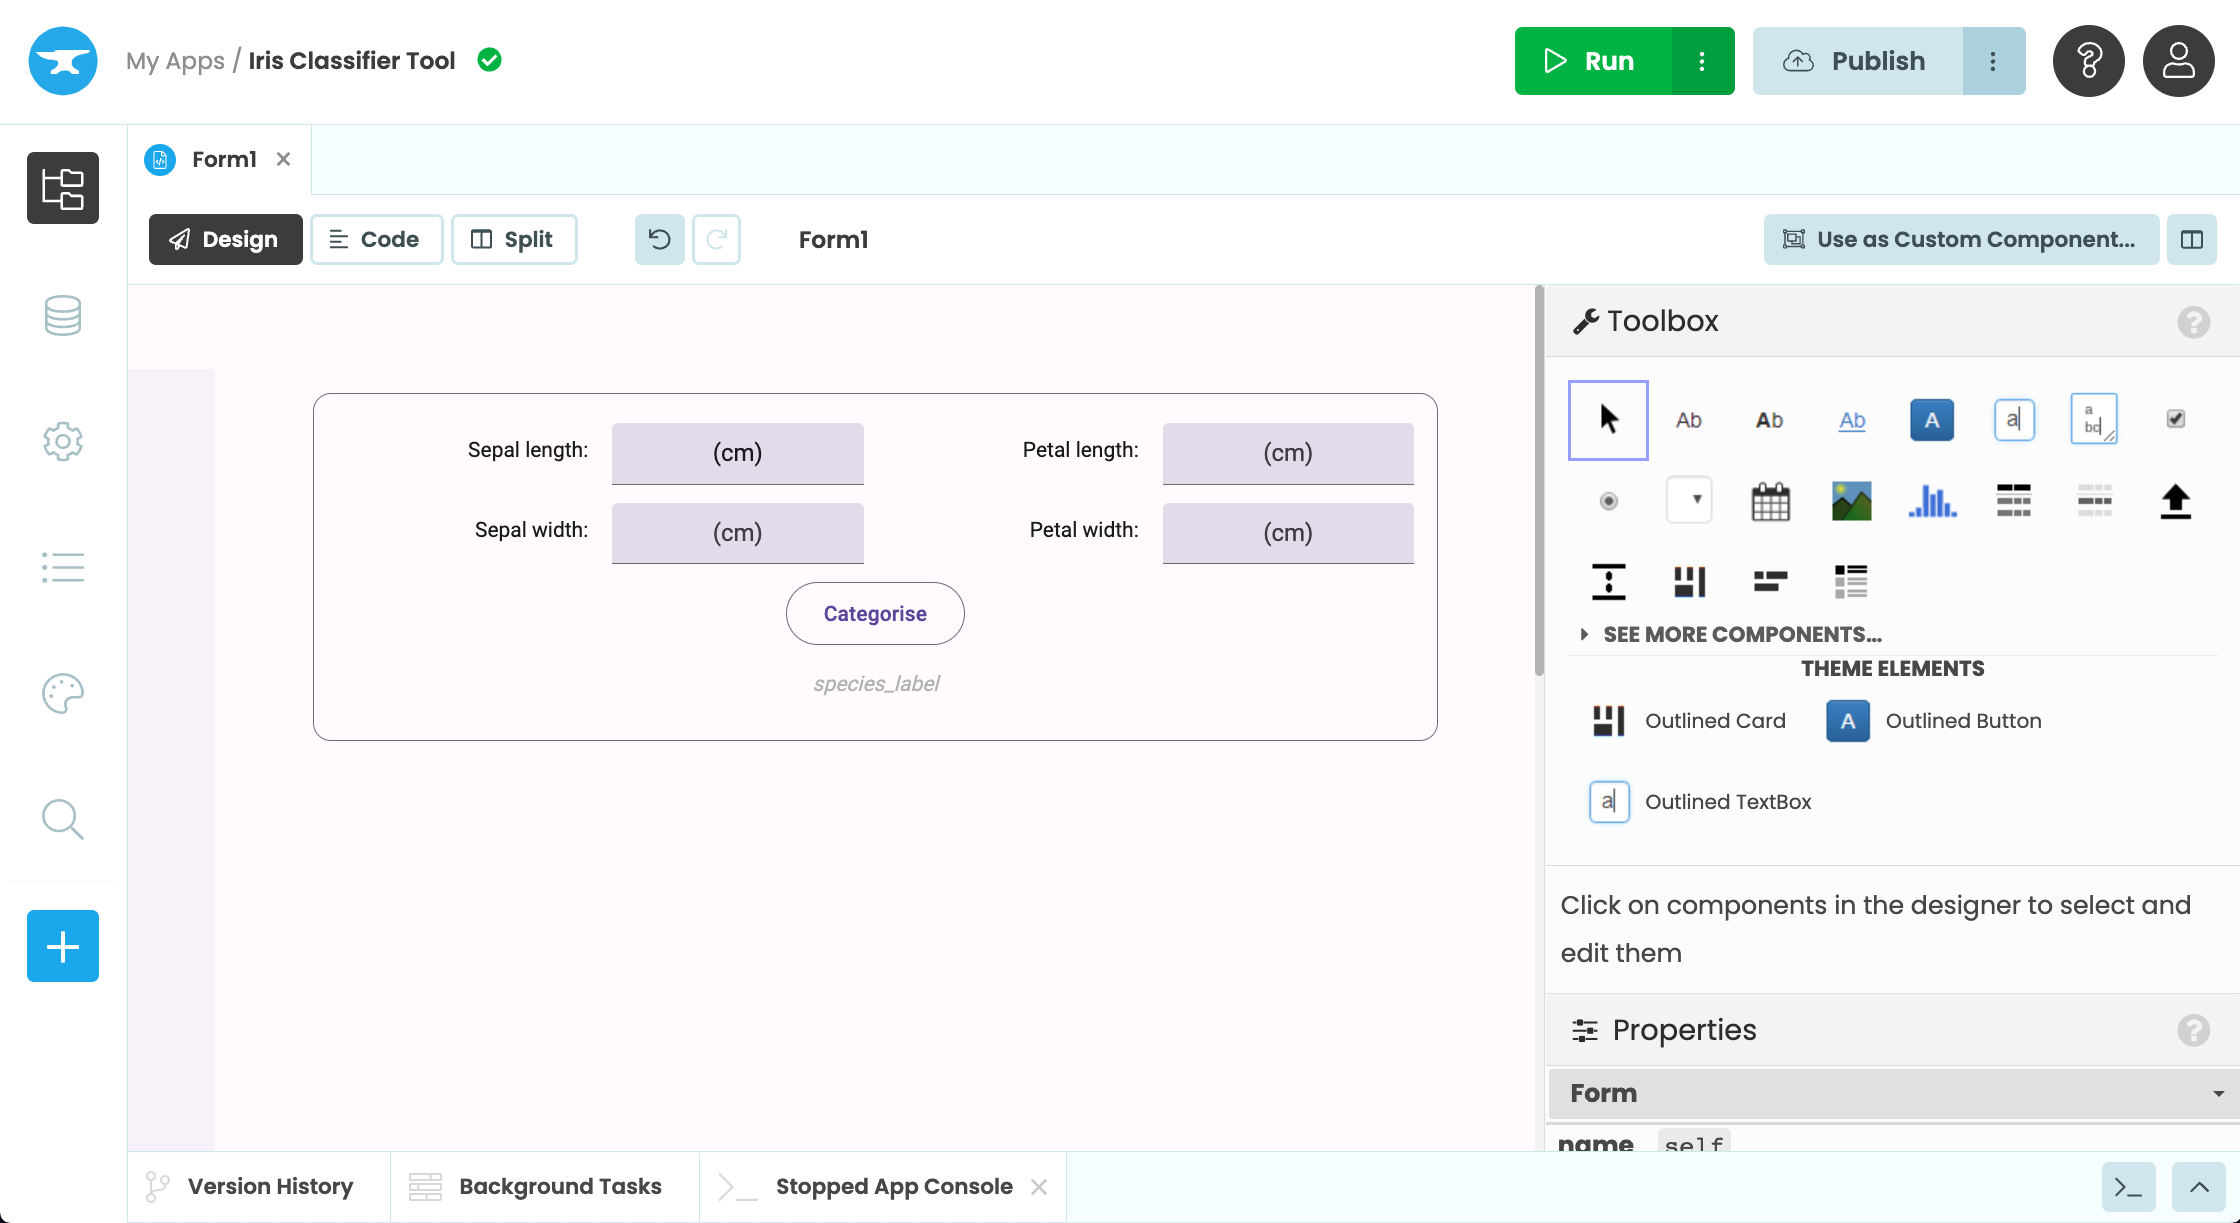
The finished Google Colab app UI
In the next step we will add some code to control what happens when a user pushes the Categorise button.
Step 3: Add a button click event
We want our categorise_button to do something when it’s clicked, so let’s add a click event.
With the button selected, click on click event from the floating Object Palette. This will open our code view and create a function called categorise_button_click. From now on, every time the button is clicked by a user, this function will be called.
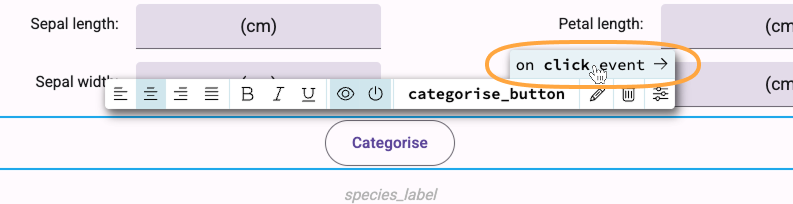
Adding a click event handler to the Categorise button
We want to call a function in our Google Colab notebook, and pass it the measurements the user has entered into our web app. When the notebook returns our answer, we’ll display it as text on the species_label.
To do this we add the following:
@handle("categorise_button", "click")
def categorise_button_click(self, **event_args):
    """This method is called when the button is clicked"""
    # Call the google colab function and pass it the iris measurements
    iris_category = anvil.server.call('predict_iris',
                                int(self.sepal_length.text),
                                int(self.sepal_width.text),
                                int(self.petal_length.text),
                                int(self.petal_width.text))
    # If a category is returned set our species
    if iris_category:
      self.species_label.visible = True
self.species_label.text = "The species is " + iris_category.capitalize()Now we have a basic UI and functionality, let’s connect our app to the code in our Google Colab notebook.