 By
By Chapter 7:
Optional: Customise your app
This part is optional! If you’re interested in learning more, we’ll show you how to style your graphs and how to make fine-grained changes to the appearance of your app.
Anvil’s themes are defined with CSS stylesheets and HTML. You can customise the look and feel of your app in the Assets Editor (under “Assets” in the App Browser). This is an advanced feature - you don’t need to write HTML or CSS to use Anvil.
Step 1: Customise plot layout
We can style our Plotly graphs by modifying their Layout property. We do this by setting it to a dictionary describing the layout of the plot.
Go back to Form1 and add this function:
  def style_plot(self, plot):
    plot.layout = go.Layout(
                            # expand the graphs
                            margin=dict(
                                l=50, #left margin
                                r=50, #right margin
                                b=50, #bottom margin
                                t=50, #top margin
                            ),
                            font=dict(family='Noto Sans', size=10),
                            # Format x-axis
                            xaxis=dict(
                              zeroline=False,
                              tickfont=dict(
                                  family='Noto Sans',
                                  size=11,
                                  color='#808080'
                              ),
                            ),
                            # Format y-axis
                            yaxis=dict(
                                zeroline=False,
                                tickfont=dict(
                                    family='Noto Sans',
                                    size=11,
                                    color='#808080'
                                ),
                            )
)Step 2: Import a custom font
In the plot layout, we’ve specified a nonstandard font (Noto Sans), so we’ll need to import it from Google Fonts. Scroll down to ‘Theme’ in the App Browser, and click on ‘Assets’:
In the dropdown at the top, select theme.css, and add this line to the top of your CSS:
/**
This CSS implements the Material Design look and feel for Anvil apps.
**/
@import url('https://fonts.googleapis.com/css?family=Noto+Sans&display=swap');
Let’s use Noto Sans as the main font for our app, not just the plots. Scroll down to the ‘Typography’ section of theme.css (around line 85), and modify the css that styles the body of your app to look like this:
/* Typography */
body {
  font-family: 'Noto Sans', sans-serif; /* edit this line */
  font-size: 14px;
  line-height: 1.4286;
  background-color: #fafafa;
}Step 3: Apply your custom layout
Finally, we need to pass each of our four graphs to the style_plot function to apply our changes. We’ll also add some titles to our graphs at the same time.
For example, to style our revenue graph and add a title, we add two lines to the end of our build_revenue_graph function so that it looks like this:
  def build_revenue_graph(self):
    db_data = anvil.server.call('get_revenue')
    self.plot_1.data = go.Bar(x = [x['date'] for x in db_data],
                              y = [x['amount'] for x in db_data],
                              marker=dict(color='#2196f3')
    )
    # Style the plot and add a plot title
    self.style_plot(self.plot_1)
    self.plot_1.layout.title = "REVENUE GROWTH"
Do this for all four graphs, run your app, and your dashboard will look something like this:
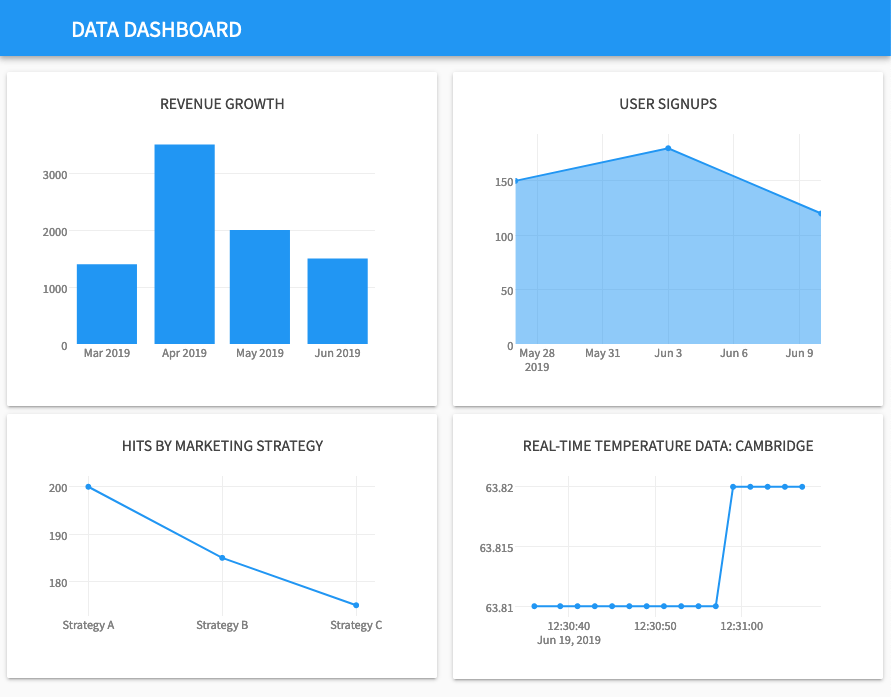
It’s looking really professional now! We’re nearly done but there’s one more thing.
In Chapter 6, we’ll add some cards above the graphs to display some headline statistics.