
Visualise data from an external database
Dashboards in Python: Visualise Your Performance
You make what you measure.
- Joe Kraus
Business is like driving - what you’re looking at is what you steer towards. A dashboard is a way to make sure you’re looking at the most important parts of your business. The good news is that they’re quite straightforward to build – especially if you have Python to help you.
I’m going to put the goodies up front, for the geeky and impatient. This is a video of me building a dashboard that pulls data from a business database, and displays it on the web. Watch it now, or read on as we take a step-by-step guide to creating your own business dashboard.
Note: This guide includes screenshots of the Classic Editor. Since we created this guide, we've released the new Anvil Editor, which is more powerful and easier to use.
All the code in this guide will work, but the Anvil Editor will look a little different to the screenshots you see here!
So, how do I do it?
Step 1: Ask the right question
This is the most important part of measuring your business. You have to ask yourself what information is so important, you should see it every morning.
When you’re building a business, the most important questions aren’t always obvious. There are some great guides out there. I’d recommend Startup Metrics for Pirates (not just for start-ups!), and Adam D’Angelo’s talk on measurement from Y Combinator’s Startup School.
Broadly, though, there are two sorts of questions: Strategic metrics that show you where you want to go, like user acquisition rate, retention, or revenue growth; and tactical metrics that monitor how you’re getting there, such as A/B tests and short-lived marketing initiatives. At very least, you should have a dashboard that shows you your strategic metrics, and how they compare to historical performance.
Don’t be afraid of hard questions.
Sometimes, the answer you need is right there in your database, and all you need is to query it. It’s great when that happens, and we’ll cover this simple case in our walkthrough.
But it’s often more complicated than that: Perhaps you’ll need data from your application database, your CRM system and an external analytics provider. Because we’re using Python to compile the data for our dashboard, we have the flexibility to do that. So you have no excuse: Don’t measure the wrong thing, just because it’s easier.
Step 2: Get the answer from your database
Let’s imagine we’ve thought about it, and decided that our primary business concern is acquisition: How many new users are we signing up, and how is that changing from week to week?
For 99% of online businesses, this information will be in an SQL database somewhere. Connect with your command-line tool of choice, and write your query. Our example table looks like this, using Postgres:
myapp=> **\d users**
                 Table "public.users"
   Column    |            Type             | Modifiers
-------------+-----------------------------+-----------
 id          | integer                     |
 email       | text                        |
 signup_date | timestamp without time zone |
A little trial and error, and we have a query that gives us the number of user sign-ups by week, for the last three months:
myapp=> SELECT COUNT(*), DATE_TRUNC('week', signup_date) AS d
             FROM users
             WHERE signup_date > NOW() - INTERVAL '3 months'
             GROUP BY DATE_TRUNC('week', signup_date)
             ORDER BY d;
Step 3: Put it online
We want to make this data visible on a web page. Anvil lets us create web apps with nothing but Python. We’re going to create an Anvil app: It will have a server module that uses the standard Python tools to extract the data from our database, and a client-side page to display it on the web (also in pure Python).
To connect to a Postgres database, we use the standard Psycopg2 library. We create a server module and write:
import psycopg2

conn = psycopg2.connect("host=db.myapp.com dbname=my_app user=postgres password=secret")
Now, we want to run that SQL query on demand. We’ll define a function that gets our data and returns it as a list:
@anvil.server.callable
def get_user_signups():
    cur = conn.cursor()
    cur.execute("""
        SELECT COUNT(*), DATE_TRUNC('week', signup_date) AS d
             FROM users
             WHERE signup_date > NOW() - INTERVAL '3 months'
             GROUP BY DATE_TRUNC('week', signup_date)
             ORDER BY d;
    """)
    return list(cur)
We’ve marked the function @anvil.server.callable. That’s all we need to make it accessible from client-side code when we build our web page. (No web server required!)
Calculating complex metrics
Remember earlier, when we said you probably want more than just a user count? This is where Python shines.
Cross-reference with a NoSQL database. Query your CRM via its API. Run statistical models with NumPy. Python is the swiss army knife of data analysis – why wouldn’t you use it for your dashboard?
Step 4: Draw the plot
All that’s left is to display this data as a graph in our web app. We open Anvil’s visual designer and add a Plot component to our app’s main page. When the app opens, we call the query function we’ve just defined, and construct a line graph with the data:
signups = anvil.server.call('get_user_signups')

# Anvil plots use the Plot.ly API: https://plot.ly/python/#basic-charts
scatter = go.Scatter(x = [signup_time for (count,signup_time) in signups],
                     y = [count for (count,signup_time) in signups],
                     fill = 'tozeroy')
We want that code to run when the page first opens, so we put it in the __init__ method of our form. (We also import the plot API.)
Here’s the entire page source code, including the parts Anvil provides for you:
from plotly import graph_objects as go
class Form1(Form1):
def __init__(self, **properties):
super().__init__(**properties)
# This code will run when the form opens.
signups = anvil.server.call('get_user_signups')
# Make a line plot of this data
scatter = go.Scatter(x = [signup_time for (count,signup_time) in signups],
y = [count for (count,signup_time) in signups],
fill = 'tozeroy')
# Display that plot on our page
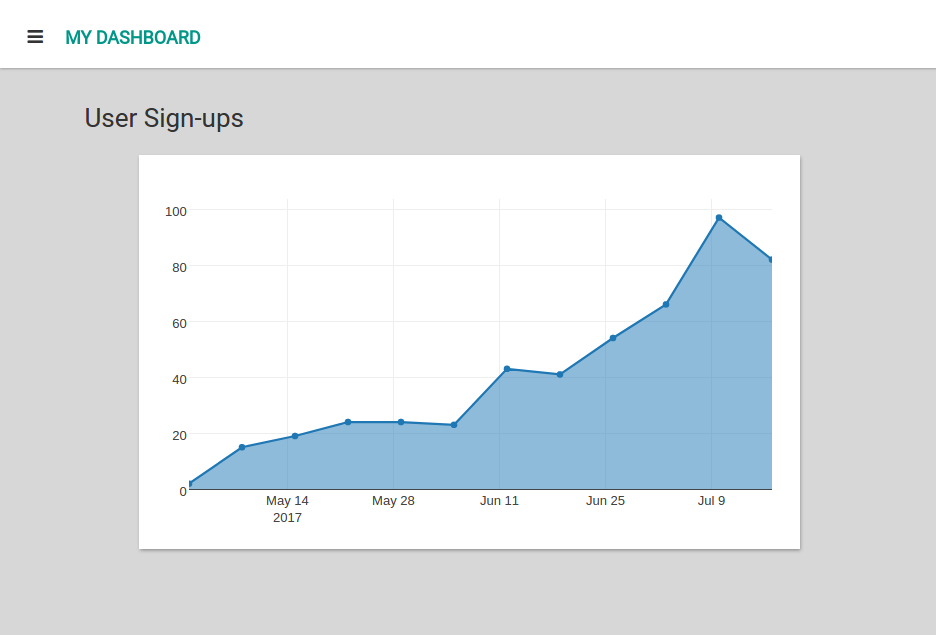
self.plot_1.data = scatterThat’s it! Here’s what it looks like, now we’re finished:
Step 5: Actually watch it
It feels silly to say it, but I know from personal experience: A dashboard you don’t look at is as bad as no dashboard at all. It’s actually worse, because knowing it’s there gives you a false sense of security.
Set your dashboard as your home page - or if you have a spare screen, display it in the corner of your office. And then, when it tells you something interesting, you might actually react!
You can see the full source code for this example here:
Do you still have questions?
Our Community Forum is full of helpful information and Anvil experts.