
App Logs
App Logs contain information about your app sessions, background tasks, and CPU and memory usage.
You can open App Logs ![]() from the Sidebar Menu:
from the Sidebar Menu:
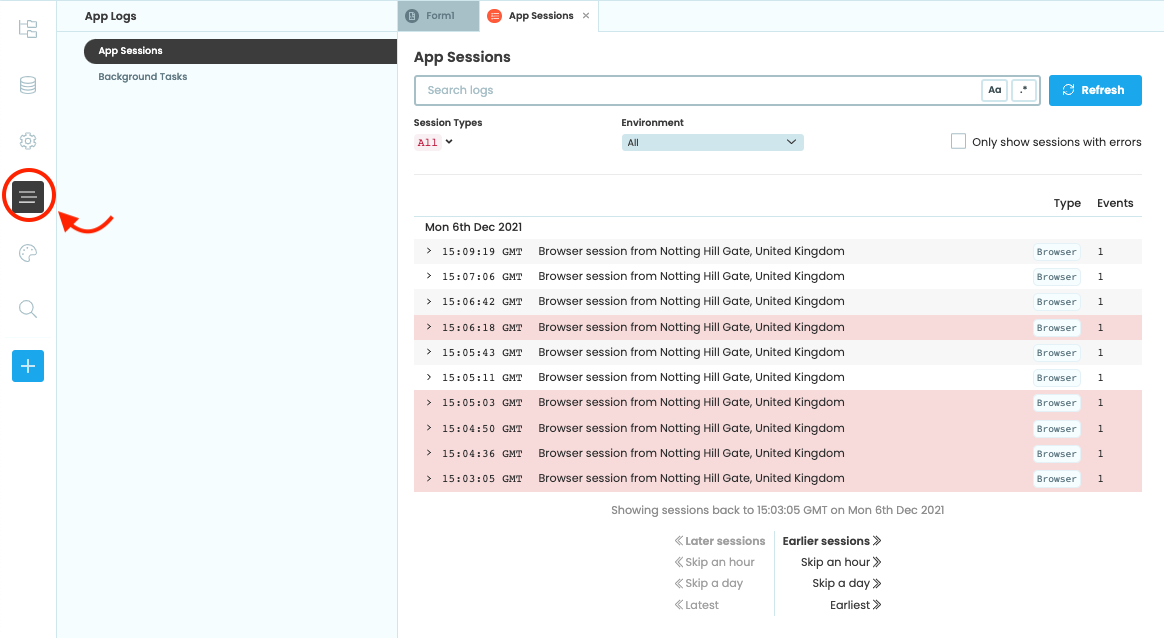
Select App Logs from the Sidebar Menu
App Sessions
The App Sessions tab shows all print() output and Exceptions from both the client and the server, grouped by session. Each new session creates a new entry in the log.
Incoming emails and requests to HTTP endpoints also create new sessions that appear in App Sessions.
Clicking on a session opens the session dialog, which shows the output from that session. Just as in the App Console, client and server output are visually distinct. The server output has an orange bar on the left-hand margin, while client output has a blue bar. In the session dialog, you can click Exception tracebacks to jump to the location in the code where the error occurred:
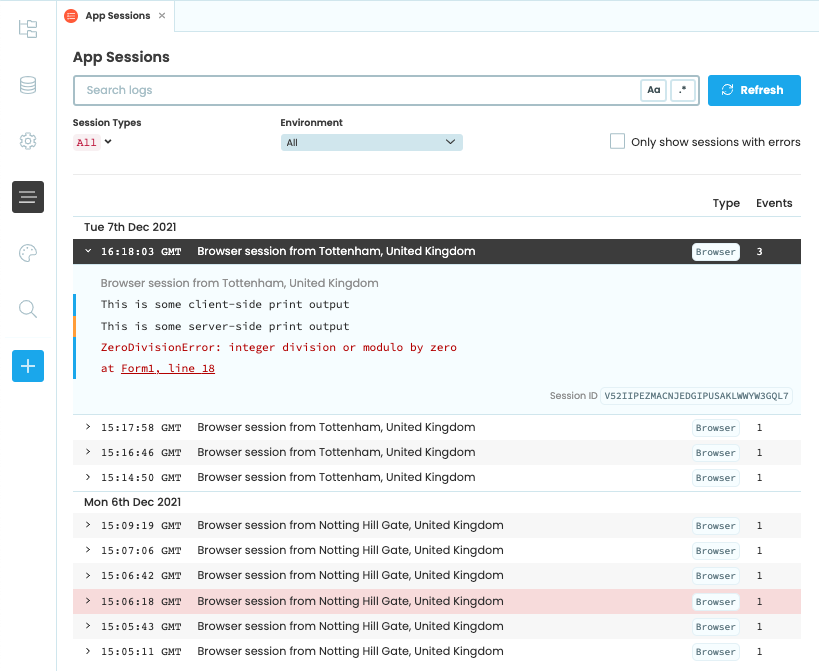
The App Sessions tab showing a session dialog
Sessions are labelled by type (Browser, HTTP, Background Task, Email, or Uplink). In the session dialog, you can also see the environment in which the session ran, making it easy to tell whether the session occurred in the Editor or in one of your app’s published environments.
Users on the Business Plan or above can also see additional profiling and tracing information about each app session. See profiling and tracing for more details.
Searching and Filtering
You can search log entries using the search bar at the top. The ![]() Case button makes your search case-sensitive, while the
Case button makes your search case-sensitive, while the ![]() Regex button enables search using regular expressions. You can also search by Session ID, which can be retrieved in a running app using
Regex button enables search using regular expressions. You can also search by Session ID, which can be retrieved in a running app using anvil.server.get_session_id().
The dropdowns under the search bar allow you to filter logs by session type and environment.
Background Tasks
The Background Tasks dialog lists all the background tasks that the app has run along with their status. Running tasks will also appear here, with a button to kill it. The ‘View logs’ button next to each task takes you to the App Logs entry for this task. There is one entry for each Background Task - all the logs from a particular task are grouped together. The background task list also shows the time it took to complete the task, as well as the environment in which the background task was triggered from.
The Background Tasks tab lists all background tasks your app has run, along with:
- Status (Running, Completed, Killed, or Failed)
- Start time and duration
- Environment the task ran in
Running background tasks have a Kill button that lets you stop them.
The View logs button next to each task opens the corresponding entry in App Sessions, where all logs for that task are grouped together. Each background task has a single session entry showing all output generated by that task.

The Background Tasks tab
CPU Usage History
The CPU Usage chart shows the total compute used by your app across all environments over a two-month period. You can select time ranges of 24 hours, 1 week, or 2 months.
To view compute usage across all apps in your plan, see Account Quotas.

CPU Usage Chart
Memory Usage
The Memory Usage chart shows what percentage of your app’s allocated memory is being used. You can select time ranges of 24 hours, 1 week, or 2 months, and filter by environment.

Memory Usage Chart
Do you still have questions?
Our Community Forum is full of helpful information and Anvil experts.