Profiling and Tracing
Your app’s App Sessions tab provides performance diagnostic tools for each session. If you choose a session and click ‘View session’, you’ll be able to find profiling and tracing tools that provide insights into your app’s performance during that session.
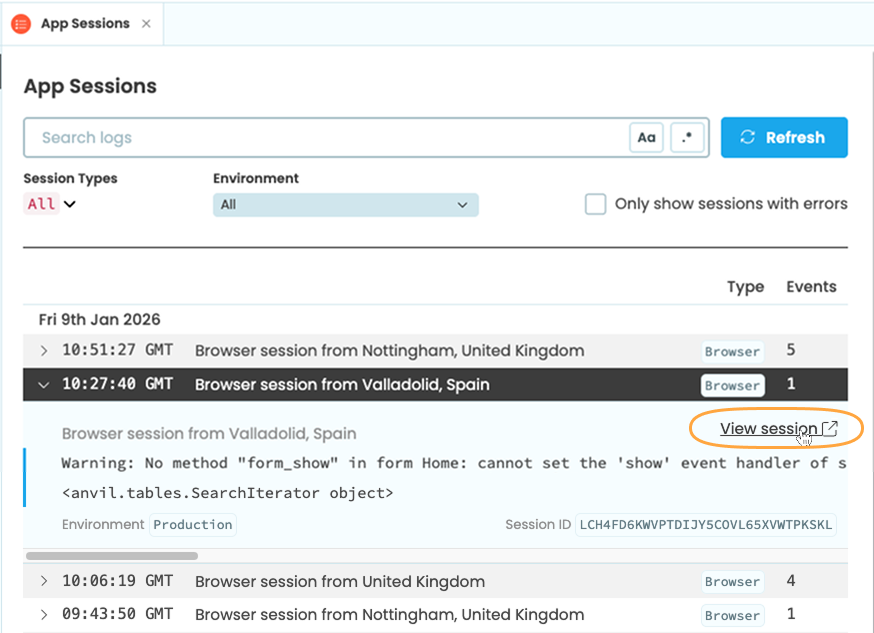
Click on ‘View session’ to find profiling and tracing tools for the session.
The Profile tab shows an overview of all the tasks that ran during the session, including how many times each task ran and how long it ran for. The Traces tab provides a timeline of these tasks, showing each subtask, when it ran and how long it ran for.
These tools are valuable for diagnosing performance issues and understanding how better to optimize your app.
Profile
In the Profile tab, you will find a table listing all the tasks that ran during the selected session. The table includes:
- Task Name
- Duration: the total amount of time that all calls to the task took to run.
- Duration (self): the total amount of time that calls to the task spent running their own code. This doesn’t include time spent in functions called by this task.
- Calls: the number of times this task ran during the session.
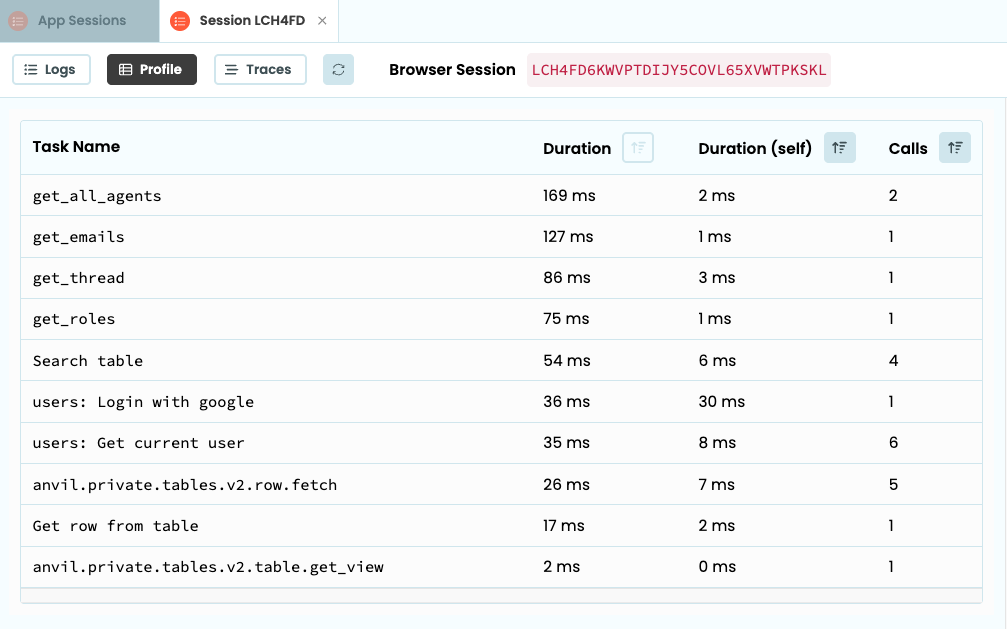
The Profile tab showing a list of tasks and their total duration.
Traces
The Traces tab shows a list of all instances of all tasks that ran during the session. Here you can see how long after the session started that the task ran and how long it ran for.
Clicking on a task name will bring up a panel with more information about that instance of the task. Here, you can find all the sub-tasks called by the task and how long each took to run.
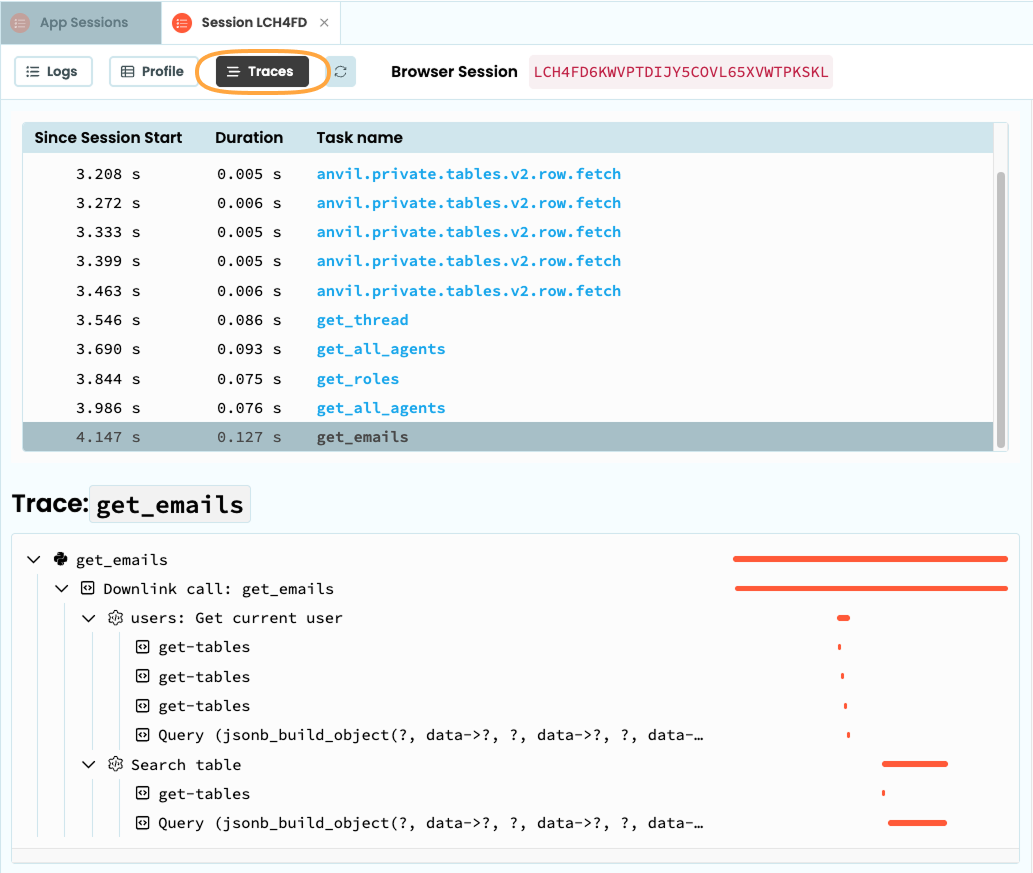
The Traces tab showing a task called get_emails and all of its sub-tasks.
Hovering over a sub-task will show you the sub-task’s name, duration and the service that ran the process.
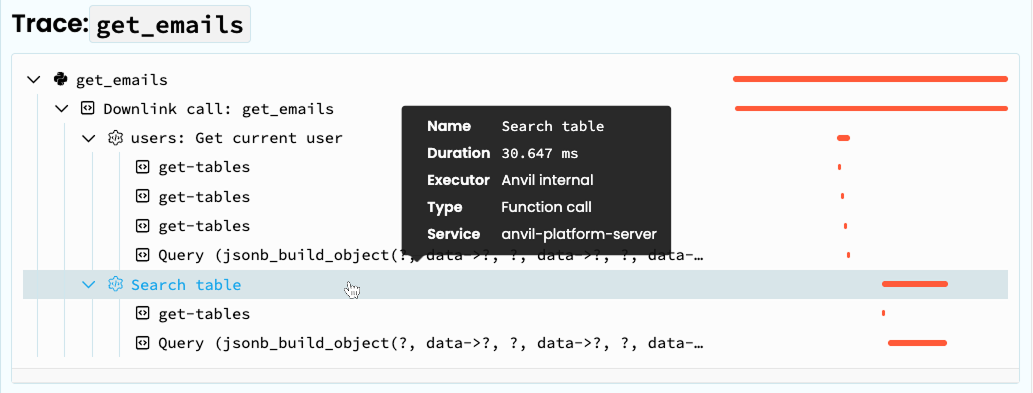
Hover over a sub-task to bring up more details
Hovering over the duration bars next to the sub-task name will show you more precisely how long the sub-task ran for as well as when it started and ended.
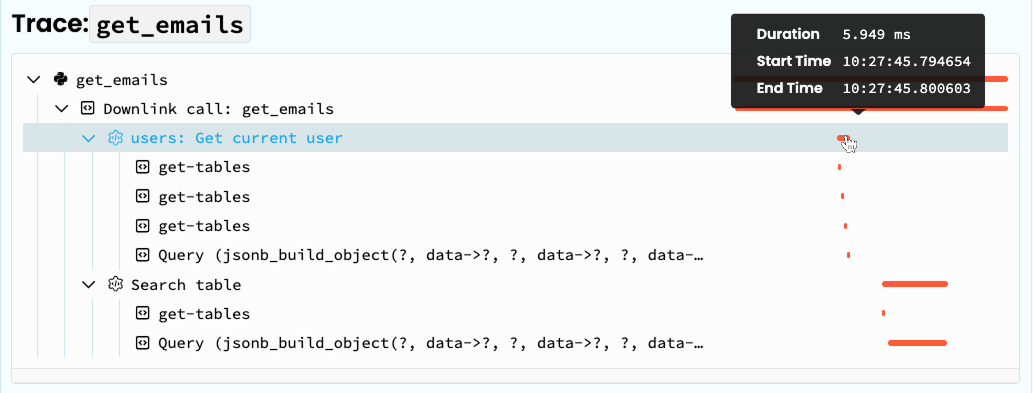
Hover over the duration of a sub-task to show more precise timestamps
Do you still have questions?
Our Community Forum is full of helpful information and Anvil experts.

