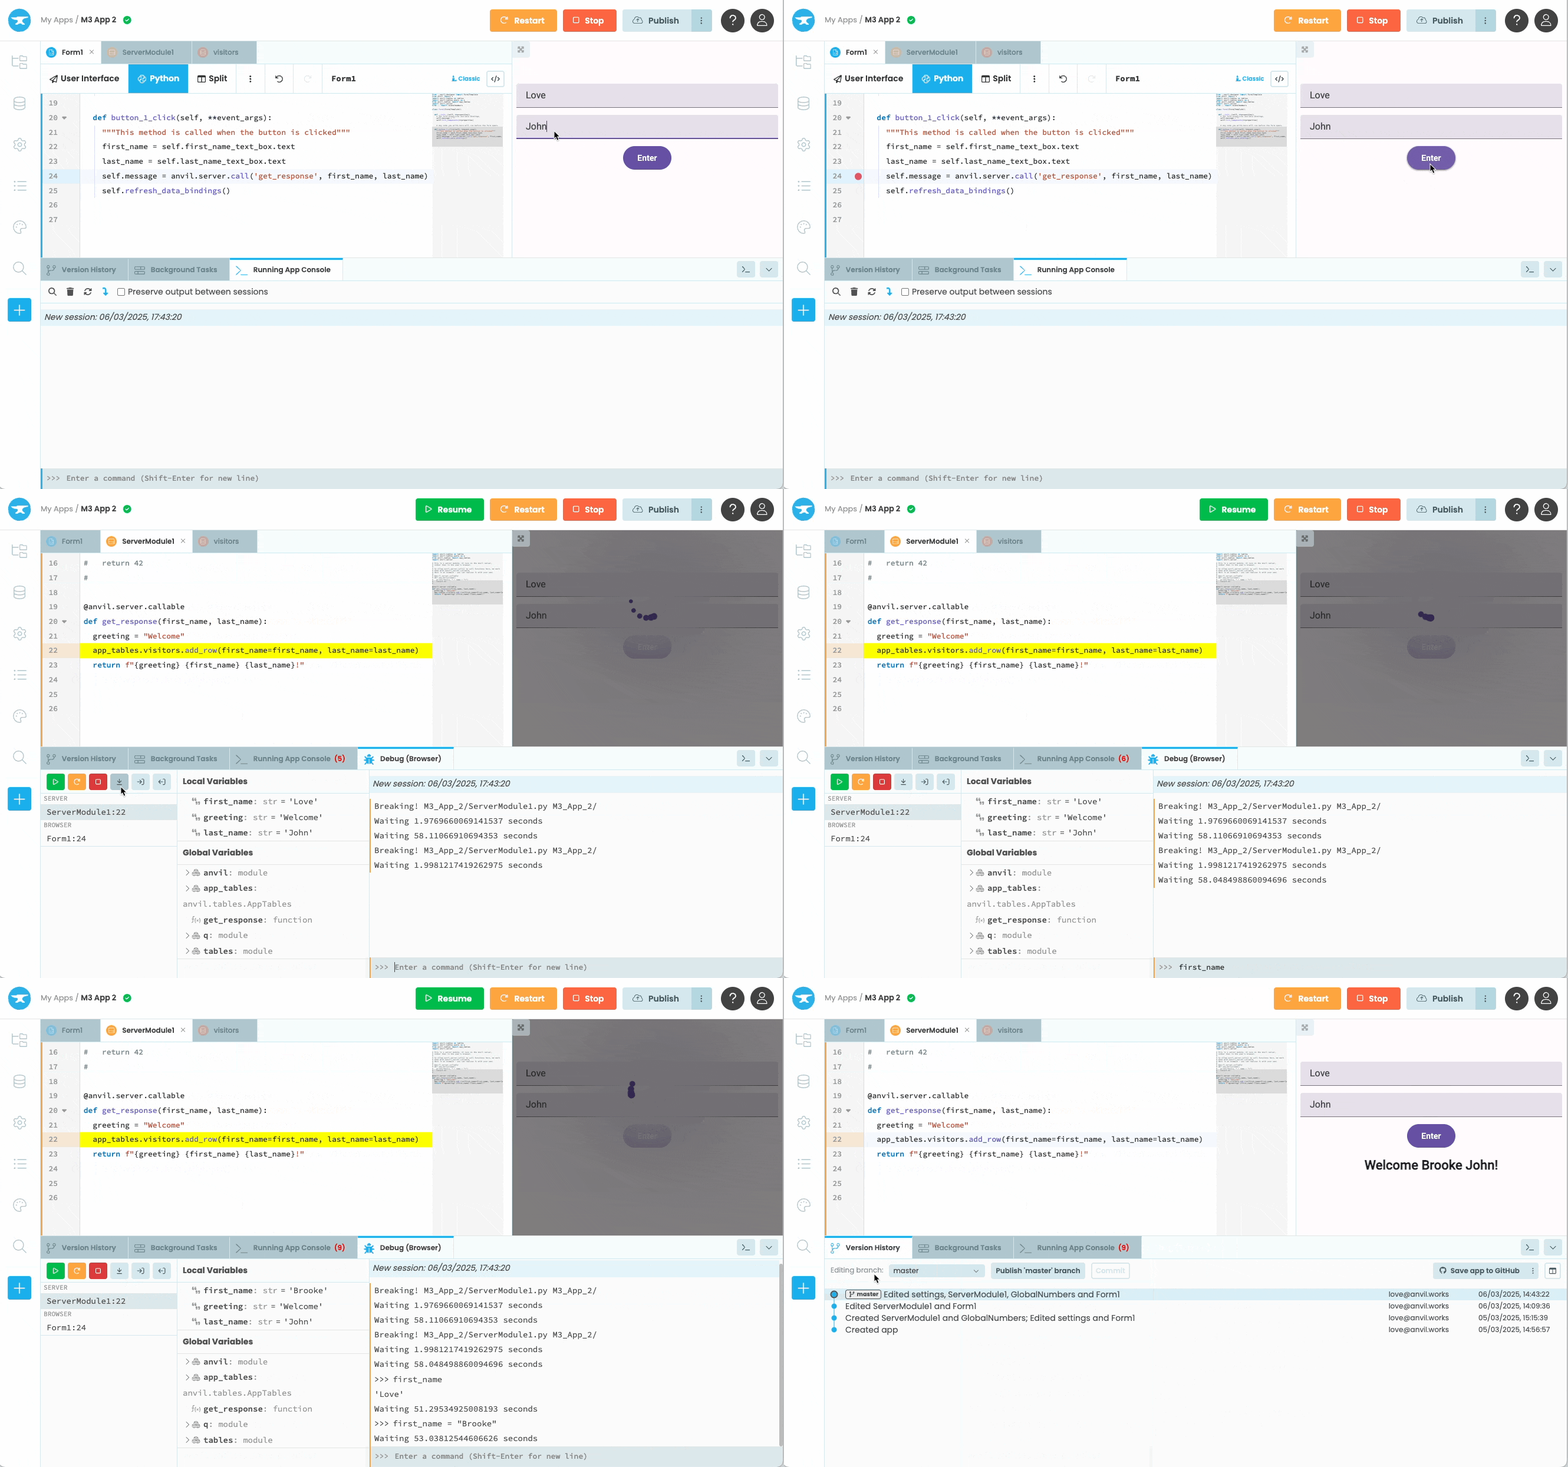
Debugging Tools in the Anvil Editor
Debugging is an essential part of building reliable applications, and the Anvil Editor makes it seamless with a suite of powerful tools.
The Interactive Debugger in Anvil lets you pause and inspect your code in real time, whether on the client or server side, helping you diagnose and resolve issues efficiently.

The Interactive Debugger
-
Server Console: A Python REPL allowing you to execute server-side code, test functions, and interact with custom Python packages.
-
App Console: A real-time REPL for interacting with your app’s UI components, inspecting properties, and triggering client and server side methods
Together, these tools give you full visibility into your app’s execution, making it easier to debug and refine your code.
Do you still have questions?
Our Community Forum is full of helpful information and Anvil experts.

