
The Interactive Debugger in Anvil
The Anvil Editor has a built-in Interactive Debugger that allows you to pause execution and inspect your code in real time, both on the client and server side. It provides tools to help you quickly diagnose and fix issues in your app.
Key Features
-
Add and Remove Breakpoints: Pause code execution at specific areas in your code both on client and server side. You can also pause on server code called from the client.
-
Explore the Call Stack: Explore the call stack across client-server boundaries and inspect variables and values at runtime.
-
Step Through Code: Easily navigate through code execution across both client-side and server-side code, with the debugger tools.
-
Interact with Objects in the Debugger REPL: Directly interact with your application’s state while debugging.
-
Safe Debugging Environment: Breakpoints only activate in your Development Environment and are ignored in published versions of your app.
-
Debug Background Tasks and HTTP Endpoints: The debugger stops at all breakpoints in your Development Environment, including in Background Tasks and HTTP Endpoints.
How it works
When you add a breakpoint to an executable line of code in the anvil editor, and run your code, your app will work as normal until execution reaches the breakpoint (the breakpoint is hit). Here is what happens then:
- Code execution is paused just before the line of code is executed.
- The line of code where execution is paused (usually at a breakpoint) is highlighted, as well as its call sites. This highlight color changes depending on whether the editor is in light or dark mode
- The Debugger Window opens, showing all local and global variables, within the scope of the breakpoint or selected call stack frame, along with the Debugger console, where you can interact with these variables.
Adding and Removing Breakpoints
Breakpoints are marked by a red circle icon ![]() in the gutter of the Anvil editor. They allow you to pause execution at specific points in your code. You can add or remove breakpoints in both client and server code at any time:
in the gutter of the Anvil editor. They allow you to pause execution at specific points in your code. You can add or remove breakpoints in both client and server code at any time:
- Before execution begins.
- While your code is running.
- When execution is paused.
💡 Tip: If execution is paused and you want to quickly skip to the end of a block of code, place a new breakpoint at the end of that block and click Resume ![]() . Execution will continue until it reaches the new breakpoint.
. Execution will continue until it reaches the new breakpoint.
Adding Breakpoints
You can add breakpoints to any executable line of code:
- Click the gutter next to the line of code you want to debug.
- A red circle icon will appear, marking your breakpoint.
Removing Breakpoints
The breakpoint behaves like a toggle, clicking on a breakpoint will remove it.
Add and remove breakpoints
The Debugger Window
Here is an image of the anvil editor with the Debugger Window open, showing its key components:
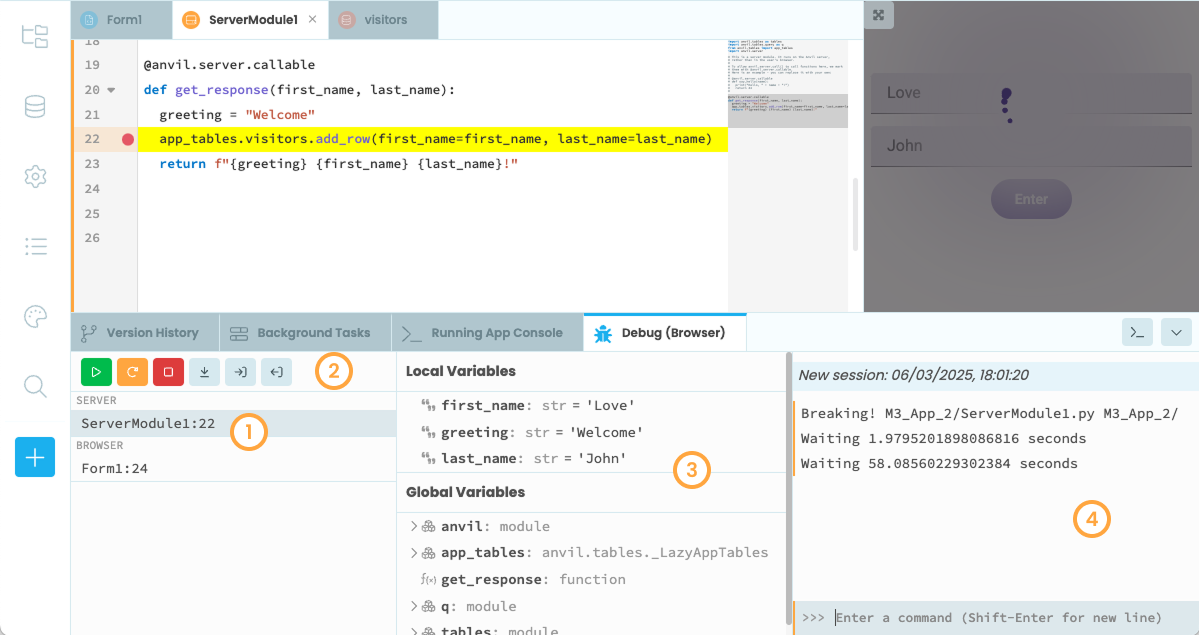
The Anvil Editor with the Debugger Window open
- Call Stack: Displays the current line of code whose breakpoint was hit and its call stack.
- Debugger Toolbar: Provides common debugging actions like stepping through code.
- Object Inspector: Shows all variables in your code, including local and global scopes.
- Debugger REPL: A Python REPL (Read-Eval-Print Loop) where you can interact with all the local and global variables within the scope of the selected call stack frame as well as all the modules and packages in your app.
The Call Stack
The call stack shows the sequence of function calls that led to a breakpoint. The call stack starts from the paused execution point and traces back through the call history.
Clicking on a call stack frame opens that line of code in your project and updates the variables in the Object inspector to reflect the objects within the context of that line of code. This makes it easy to navigate through the execution flow and debug effectively.
Clicking between Call Stack frames
The call stack is grouped into two sections: Browser for client-side calls and Server for server-side calls, showing a clear view of the execution flow.
The Debugger Toolbar
The debugger toolbar has the following actions:
![]() Resume: Continue executing indefinitely, or until the next breakpoint.
Resume: Continue executing indefinitely, or until the next breakpoint.
![]() Restart: Stop the current process and restart your application, which will run until it encounters the first breakpoint.
Restart: Stop the current process and restart your application, which will run until it encounters the first breakpoint.
![]() Stop: Terminate the current process.
Stop: Terminate the current process.
![]() Step Over: Execute the current line of code and pause execution on the next line, whether or not it has a breakpoint.
Step Over: Execute the current line of code and pause execution on the next line, whether or not it has a breakpoint.
![]() Step Into: If this line of code is a function call, go into the function and pause at its first executable line(it will skip comments and blank lines). Otherwise, step over this line of code.
Step Into: If this line of code is a function call, go into the function and pause at its first executable line(it will skip comments and blank lines). Otherwise, step over this line of code.
![]() Step Out: Execute to the end of the current function and then pause.
Step Out: Execute to the end of the current function and then pause.
Object Inspector
The Object Inspector displays all objects available in the current scope of the selected call stack frame. These objects are arranged in alphabetical order according to their names and are grouped into two categories:
- Local Variables: These include all local variables available at the point where execution is paused. They are specific to the scope of the selected call stack frame.
- The Global variables: Objects that exist in the module of the selected call stack frame.
You can expand and collapse objects in the object inspector by clicking on the arrow icon:
Expand and collapse variables
The Debugger REPL
The Debugger REPL is a Python REPL that allows you to directly interact with the current state of your application during debugging.
In the Debugger REPL, you can:
- Interact with all objects within the scope of the selected call stack frame, as well as the modules and custom packages used in your application.
- Create variables and objects, which will be available as local variables and appear in the Object Inspector. The changes made within each call stack frame are preserved and will survive across call stack frame switching.
global keyword.
Updating a Variable’s Value in the Debugger REPL
The Debugger Repl marks server-side code with an orange line along the left edge of the REPL window, while code running on the client side is marked with a blue line.
At the end of a debugging session, your debugger console history will be seen in the Running App Console.
Debugging Background Tasks and HTTP Endpoints
You can use the debugger to pause execution and inspect variables in Background Tasks and HTTP Endpoints within your Development Environment.
When you add breakpoints inside a background task or an HTTP endpoint in your server modules, the debugger will pause execution at that point, just like in regular server code. This lets you step through the code and debug as needed.
Do you still have questions?
Our Community Forum is full of helpful information and Anvil experts.