 By
By Chapter 4:
Display the summary data
Let’s move onto our other visualisation: the summary data.
Once again, go back to the server function and add the lines below to extract the summary data. Note that we’re now also returning summary_data from this function, so remember to add that to your return statement.
@anvil.server.callable
def get_forecast_data(location):
  API_URL = f"http://api.openweathermap.org/data/2.5/forecast?lat={location['lat']}&lon={location['lon']}&appid={anvil.secrets.get_secret('api_key')}&units=metric"
  response = anvil.http.request(API_URL,json=True)
  # Extract forecast data
  times = [datetime.fromtimestamp(i['dt']) for i in response['list']]
  temps = [i['main']['temp'] for i in response['list']]
  # Extract summary data
  summary_data = {"temp_min": response['list'][0]['main']['temp_min'],
                  "temp_max": response['list'][0]['main']['temp_max'],
                  "description": response['list'][0]['weather'][0]['description'],
                  "icon": response['list'][0]['weather'][0]['icon']}
  return times, temps, summary_data
Back in Form1, we’re going to expand our refresh function to display the data on our components.
First, our server function now returns summary data as well, so add that to the first line:
def refresh(self):
    times, temps, summary_data = anvil.server.call('get_forecast_data', self.location)
    self.plot_1.data = go.Scatter(x=times, y=temps)
    self.plot_1.layout.title = "5-day Forecast"
Now, we’re going to set the text of the temperature labels and the description_label, as well as the image source for icon (all OpenWeather icons can be accessed through a URL like the one below):
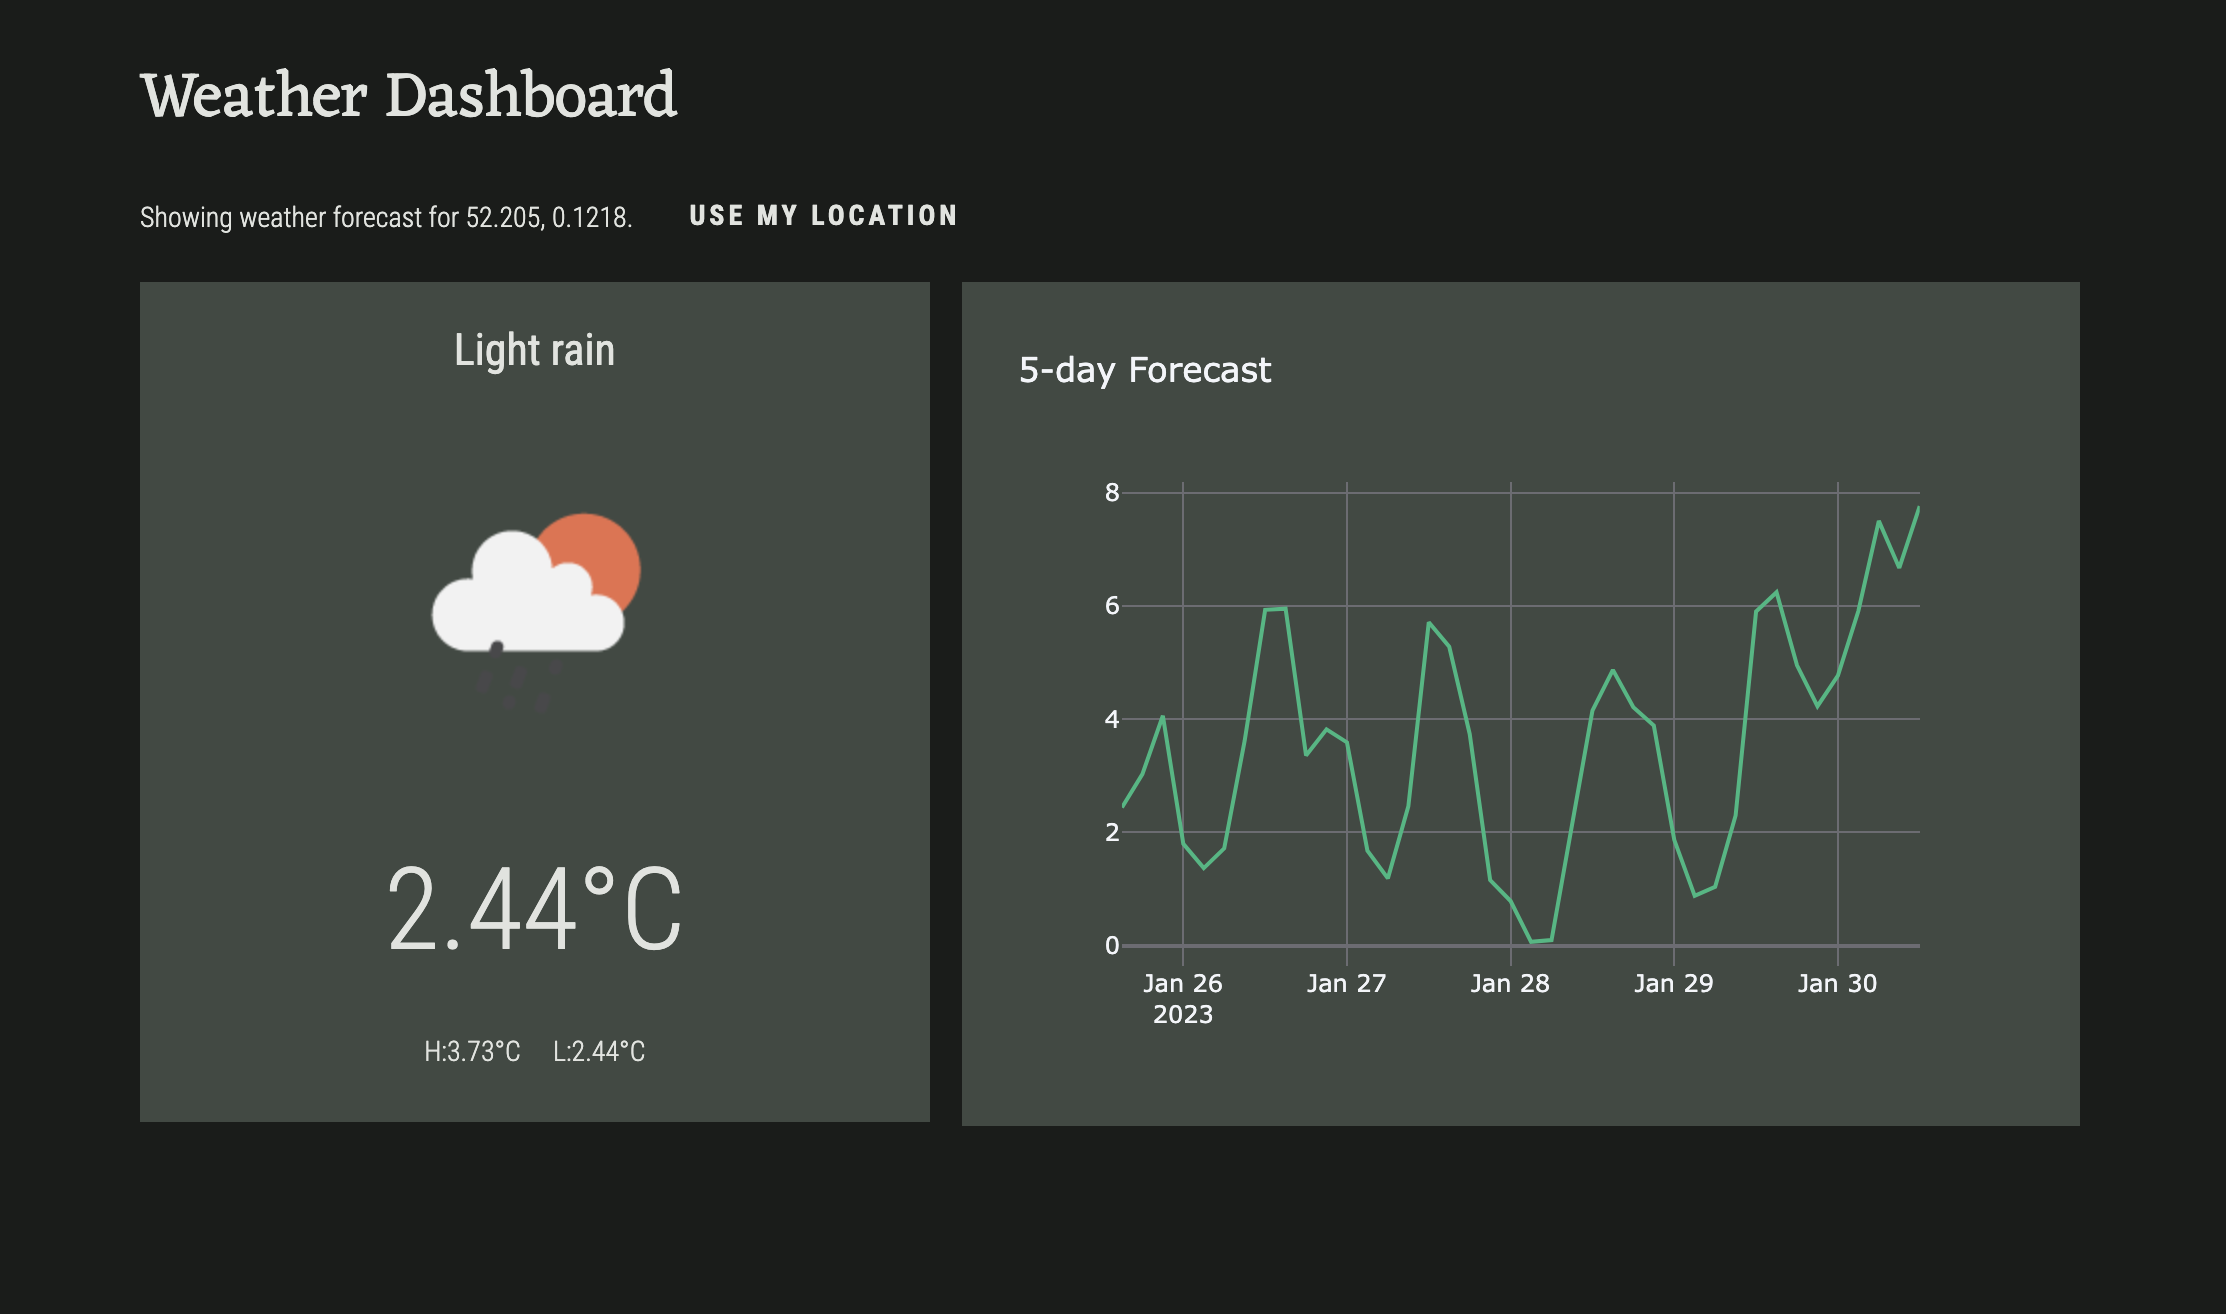
  def refresh(self):
    times, temps, summary_data = anvil.server.call('get_forecast_data', self.location)
    self.plot_1.data = go.Scatter(x=times, y=temps)
    self.plot_1.layout.title = "5-day Forecast"
    self.temp_label.text = f"{temps[0]}°C"
    self.min_label.text = f"L:{summary_data['temp_min']}°C"
    self.max_label.text = f"H:{summary_data['temp_max']}°C"
    self.description_label.text = summary_data['description'].capitalize()
    self.icon.source = f"https://openweathermap.org/img/wn/{summary_data['icon']}@4x.png"
Run your app. This is what the dashboard should look like when running it: