Build interactive visualisations from API data
In this tutorial, we’ll be building an interactive dashboard using data from a REST API. We’ll be fetching data from the OpenWeatherMap “5 Day / 3 Hour Forecast” API, and we’ll use Plotly and Anvil’s built-in components to visualize it.
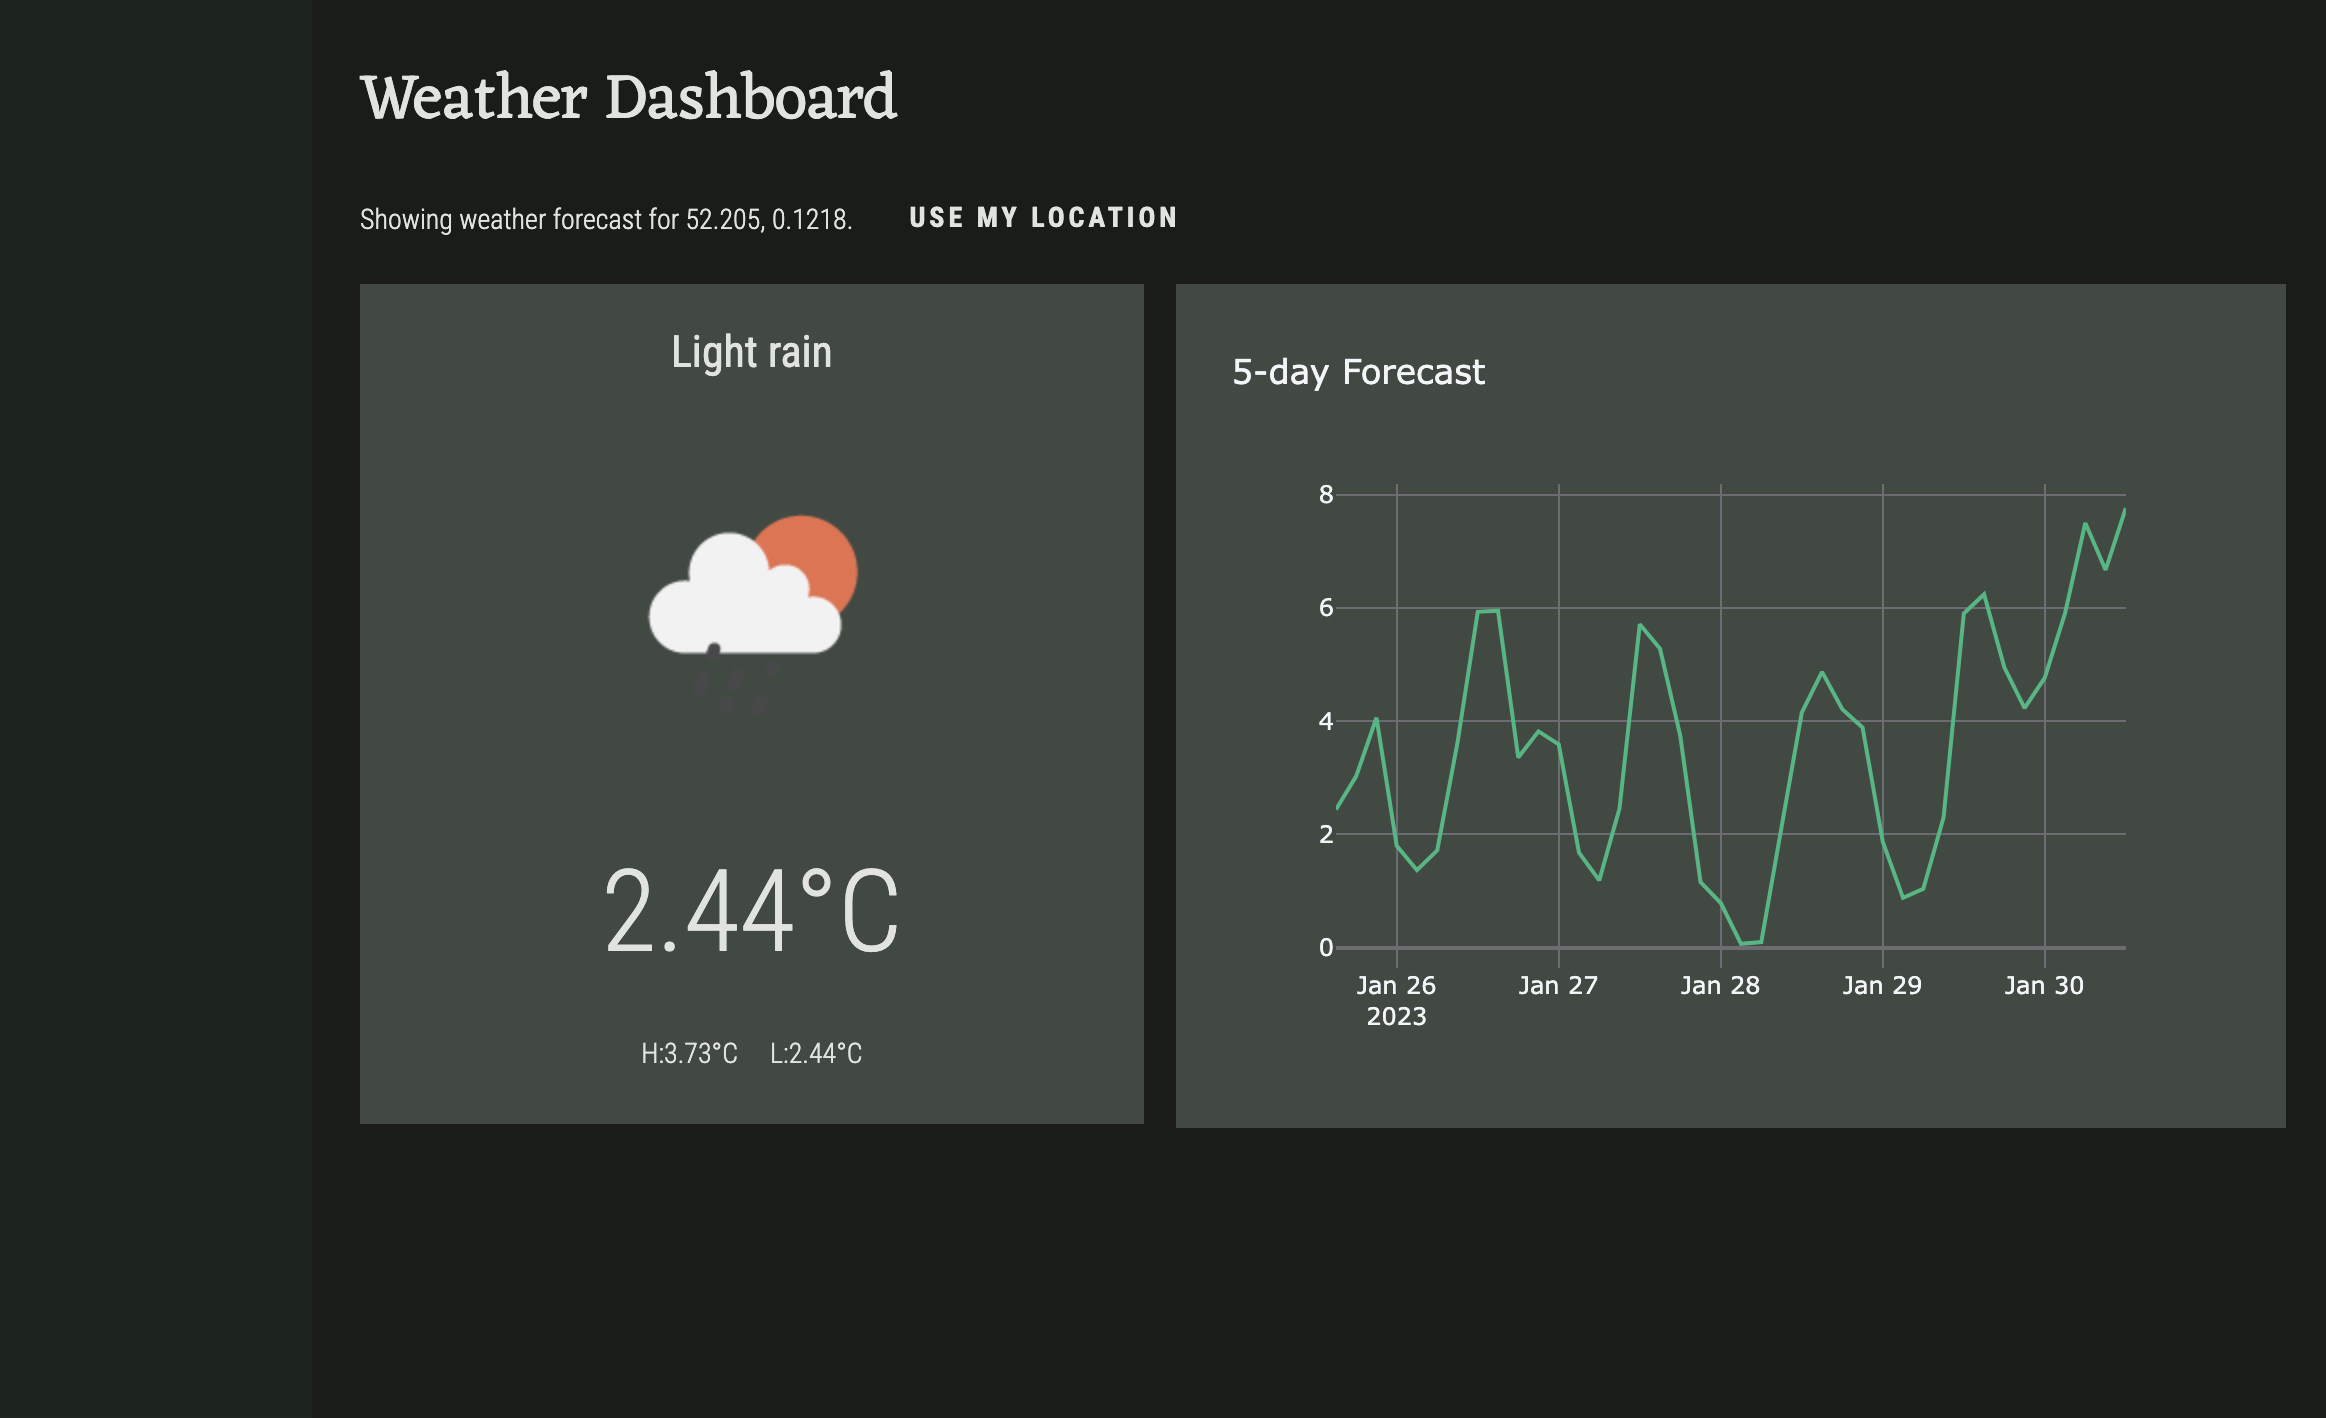
This is how the final app will look:
Chapters
In this tutorial, you'll:Build your user interface
Create your app and build your UI
Create the forecast plot
Use Plotly to plot the forecast data.
Display the summary data
Display the current weather’s summary data.
Make it real-time and update the location
Add a Timer component to make it real-time and access the user’s location to be able to display its weather data.