 By
By Tableau Analytics in an Anvil web app
Let’s say you have a data dashboard in Tableau and you want to extend its functionality. With Anvil, you can create Tableau extensions with nothing but Python. In this tutorial, I’m going to teach you how to set up Anvil’s Tableau integration and embed an Anvil app in your Tableau dashboard.

Finished App with Tableau Integration
We’re going to use an example Tableau Workbook, which is an interactive map of sales for a fictitious company in the USA. The workbook lets users click on a US state and see the corresponding sales data.
For the Anvil app, we’ll be using a pre-made example app that lets users comment on the US state’s sales data.
Prerequisites:
- Have a Tableau Online account
Steps that we will cover:
- Cloning the example Anvil app
- Connecting an Anvil app to Tableau
- Adding an extension URL to the Tableau safe list
- Adding an extension to a Tableau Dashboard
- Adding the Tableau URL into your Anvil app
- Using the Tableau API in code
Let’s get started.
Step 1 - Cloning the example Anvil app
We are using a pre-made example app to help us get started with this tutorial. When a user selects a US state in the Tableau dashboard, they can then use the Anvil app to add comments about the selected US state. The Anvil app then stores those comments in Anvil’s built-in database.
Let’s start by using the following clone link to make a copy of the app:
Now we can start integrating the Anvil app with Tableau.
Step 2 - Enabling the Tableau API service
From the Anvil Editor, let’s enable the Tableau API. Click the blue plus button  in the Sidebar Menu and then select the Tableau Service:

Tableau service being added
Next, we will start adding the details of our Anvil app to Tableau.
Step 3 - Add your extension URL to the Tableau safe list
Click the green Test in Tableau button at the top right of the editor and download the extension manifest file.

Extension manifest file being downloaded
Then, copy the extension URL from the instructions.
Next, login to Tableau online and select Settings from the navigation bar on the left-hand side. Open the Extensions tab and under Enable Specific Extensions, add the URL of the extension.
Once added, change Full Data Access to Allow and User Prompts to Hide.
Opening settings in Tableau Online and adding URL of extension
That’s it! We’ve added our Anvil app to the Tableau safe list. Next, let’s look at how we can add our Anvil app as an extension to our Tableau Dashboard.
Step 4 - Add your extension to your Tableau Dashboard
For this tutorial, we’re going to use an example Tableau Workbook which is an interactive map of sales for a fictitious company in the USA. Click the link below to download the workbook:
Navigate back to the Tableau homepage, and in the top right corner, select the New button. Then, select Upload Workbook. Select the file from your machine and click Upload. This will bring you into the view Sheet 1.

Uploading the Workbook from your machine
In the top navigation bar, select Edit. From the Objects section at the bottom left of the screen, drag Extension to the dashboard. In the Add an Extension dialog box, click Access Local Extensions, and navigate to the extension manifest file we downloaded in step 2.

Dragging an extension into the dashboard and adding the extension manifest file
Our Anvil app is now embedded in our Tableau dashboard. To complete the integration, we will add the dashboard URL to our Anvil app.
Step 5 - Enter your Dashboard URL
Select Publish from the navigation bar above of the Workbook. A notification will appear saying the notebook has been published. Click the Go to Workbook button in the notification.
Copy the URL of the published Workbook, and go back to the Anvil Editor. If the Test your Tableau extension instructions box has been closed, select the three vertical dots next to the Load Dashboard button at the top of the editor and select Configure Dashboard.... In the Test your Tableau extension instructions box, paste the URL.
The URL should look something like this:
https://prod-uk-a.online.tableau.com/#/site/anviltest2/views/superstore-anvil-extension-workbook/Overview
Publishing and going to the Workbook
Step 6 - Using the Tableau API in code
We now have the integration set up, and our Anvil app is added to our Tableau workbook. Now, we can access data and worksheets within the Tableau dashboard through Tableau’s Extensions API. The following diagram shows the relationship between the Tableau extension’s namespace and the worksheets in the dashboard.
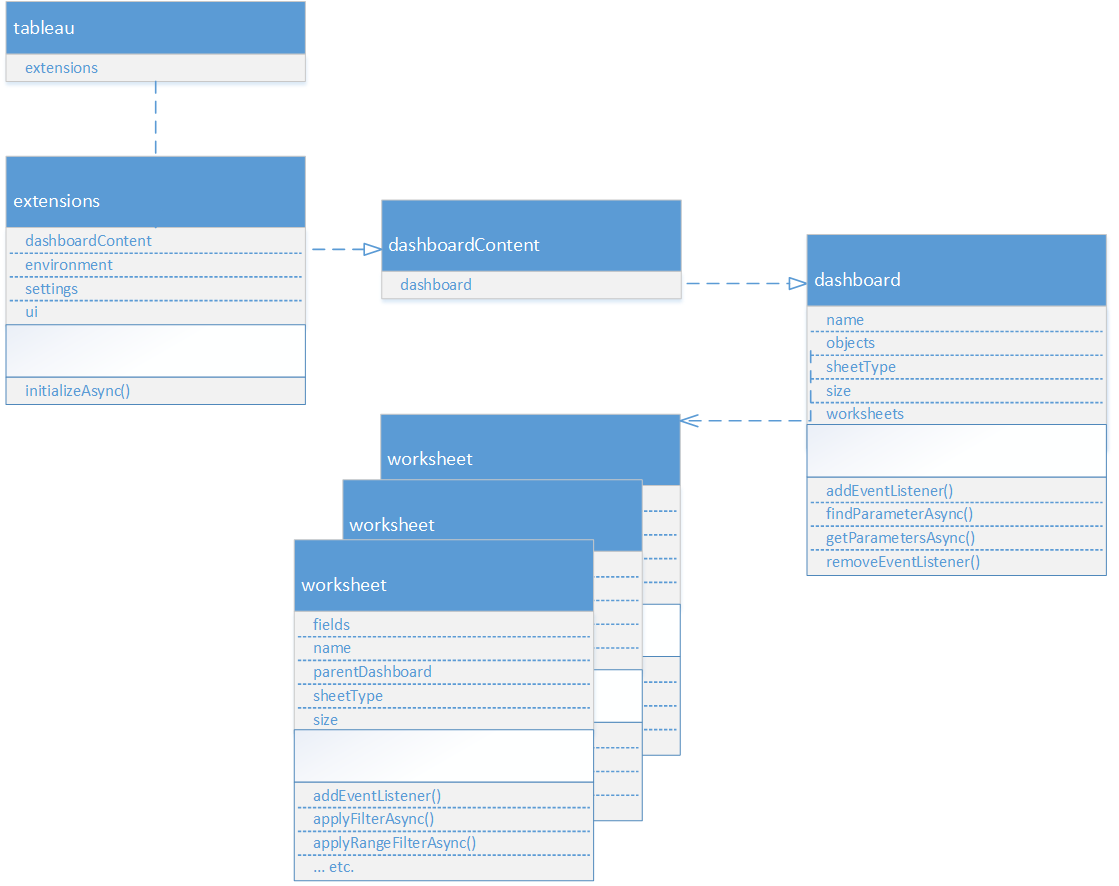
Tableau’s extension API namespace diagram
We can use Tableau’s API in client code. Let’s start by getting our Tableau worksheet in Form1. In the __init__ method of Form1 enter the following line of code:
sales_worksheet = tableau.extensions.dashboardContent.dashboard.worksheets[0]Next, let’s add an event listener to our worksheet that triggers when a user selects a US state. We will use Tableau’s addEventListener() function.
sales_worksheet.addEventListener()addEventListener() takes two arguments. The first argument defines what event to listen for. We will listen for Tableau’s MarkSelectionChanged event. Tableau displays data using marks, where every mark corresponds to a row in the dashboard’s data source. In our example Tableau dashboard, this means each mark corresponds to a US state. Therefore, MarkSelectionChanged will listen for when the user of our workbook changes the selected US state.
sales_worksheet.addEventListener("mark-selection-changed", )The second argument is the function we want to call when the event has been triggered. We will call the selected() function from our Anvil app’s Form1. The selected() function will process the data returned by the MarkSelectionChanged event and assign the data to Form1’s self.mark variable. Our app can then add the details of the mark (i.e. US state) to our database when the user of our app clicks our app’s + Comment button.
sales_worksheet.addEventListener("mark-selection-changed", self.selected)Great! We’re now calling Tableau API functions in our Anvil app and saving the data to our Anvil database.
Conclusion
That’s it! We have an Anvil app integrated and running in our Tableau workbook. We’ve learnt how to set up the integration, how to embed Anvil app’s as extensions in Tableau dashboards and how to interact with Tableau’s API in Anvil.
Going forward, we can write code in our app to store information in a database, create forms and process data all with our favourite Python libraries.

Testing the integration
New to Anvil?
If you’re new here, welcome! Anvil is a platform for building full-stack web apps with nothing but Python. No need to wrestle with JS, HTML, CSS, Python, SQL and all their frameworks – just build it all in Python.
Yes – Python that runs in the browser. Python that runs on the server. Python that builds your UI. A drag-and-drop UI editor. We even have a built-in Python database, in case you don’t have your own.
Why not have a play with the app builder? It’s free! Click here to get started: