 By
By Air Quality Dashboard
In May 2019, the government of Mongolia decided to ban the burning of raw coal in lieu of “enhanced” coal fuel. They claimed this would reduce air pollution which is caused, in part, by the burning of coal for heat and cooking in areas that don’t have proper access to infrastructure.
To answer whether the coal ban was working or not, Robert Ritz built agaar.mongol.ai. The app has a number of dashboards to monitor the air quality of the city and is a great example of how you can make data accessible to the benefit of everyone.
Making data accessible online requires a lot of interdisciplinary knowledge. Anvil simplifies the discipline of web development to allow you to focus on bringing your data to life. You can write your whole web app in Python and build dashboards in your favourite frameworks – no HTML, CSS or Javascript required!
Some highlights of Robert’s app include:
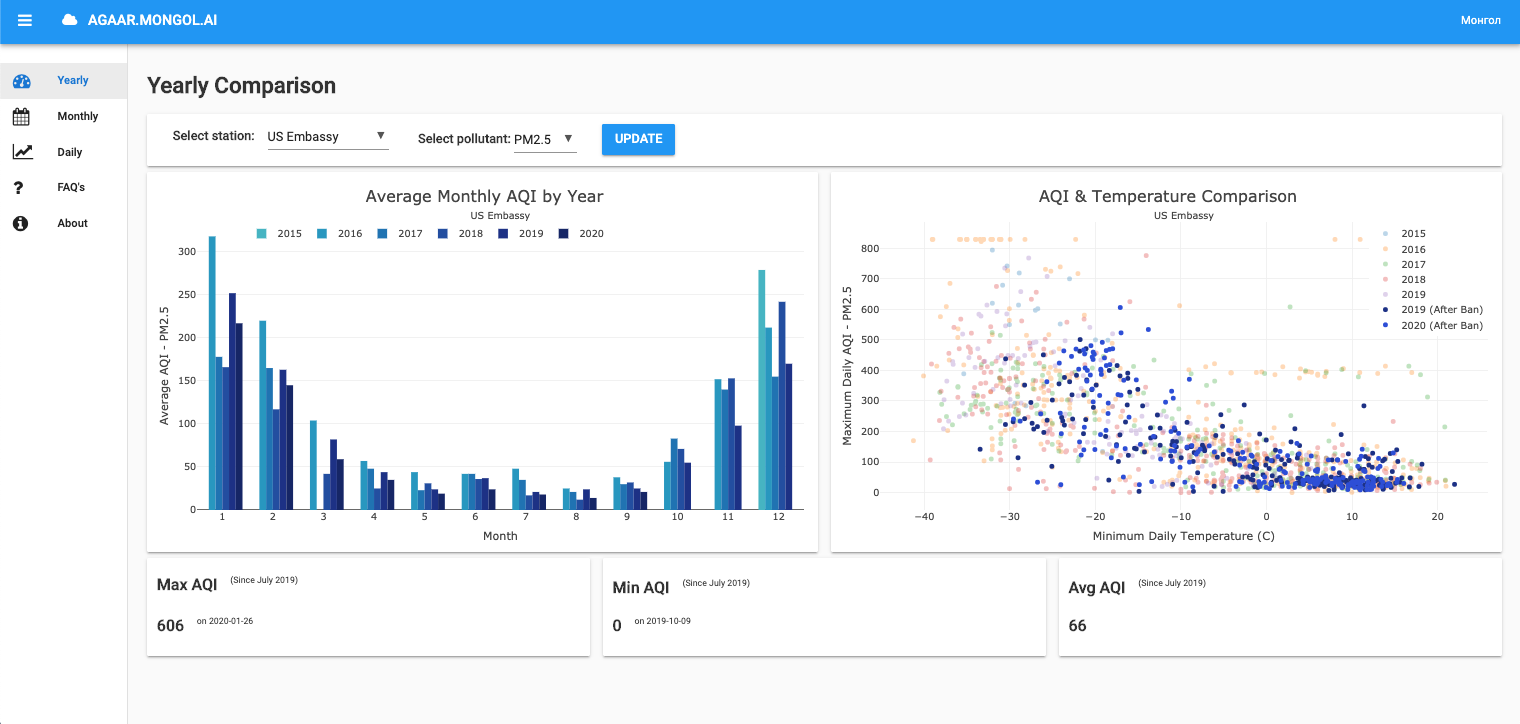
- Yearly view that also highlights the air quality index after the coal ban.
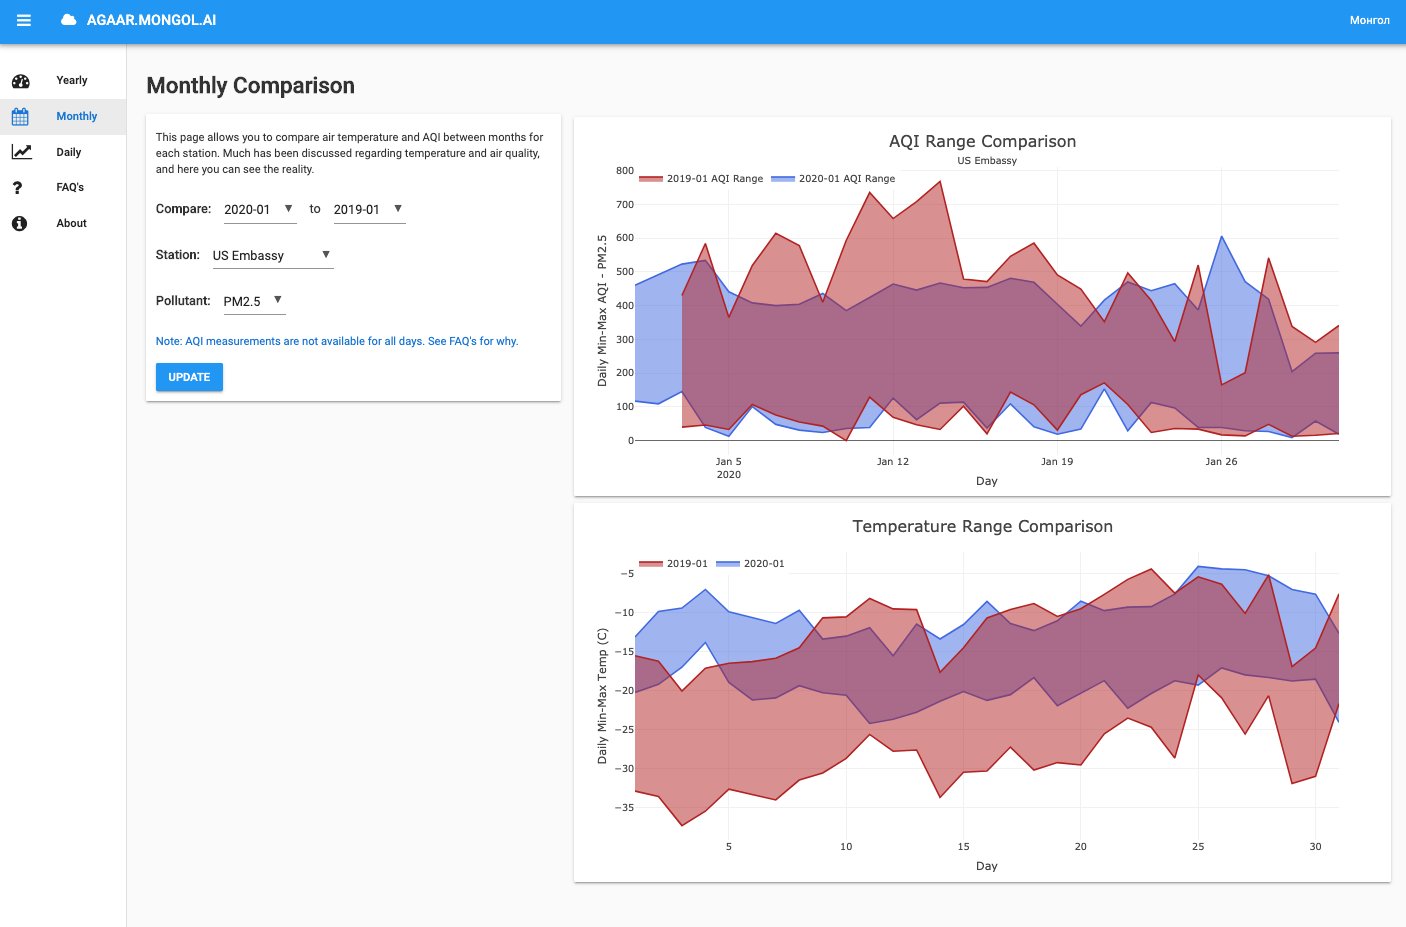
- Monthly view that shows the air quality index and temperature ranges for two months.
- Daily view that shows a selected day compared to days that are identified as having similar weather.
We highly recommend taking a look at the app:
If you feel like giving Robert kudos for his work, you can show your appreciation on his show and tell forum post.
Build your own app with Anvil
If you’re new here, welcome! Anvil is a platform for building full-stack web apps with nothing but Python. No need to wrestle with JS, HTML, CSS, Python, SQL and all their frameworks – just build it all in Python.
Want to build dashboard apps of your own? Get started with our tutorial on building dashboards with Python: