 By
By Monitor Your App’s Resource Usage
We’ve rolled out new tools to help you monitor your app’s resource usage in Anvil.
You can now track CPU, memory, and database usage at both the app and account level, helping you stay on top of your quotas and identify resource-heavy apps.
What’s New?
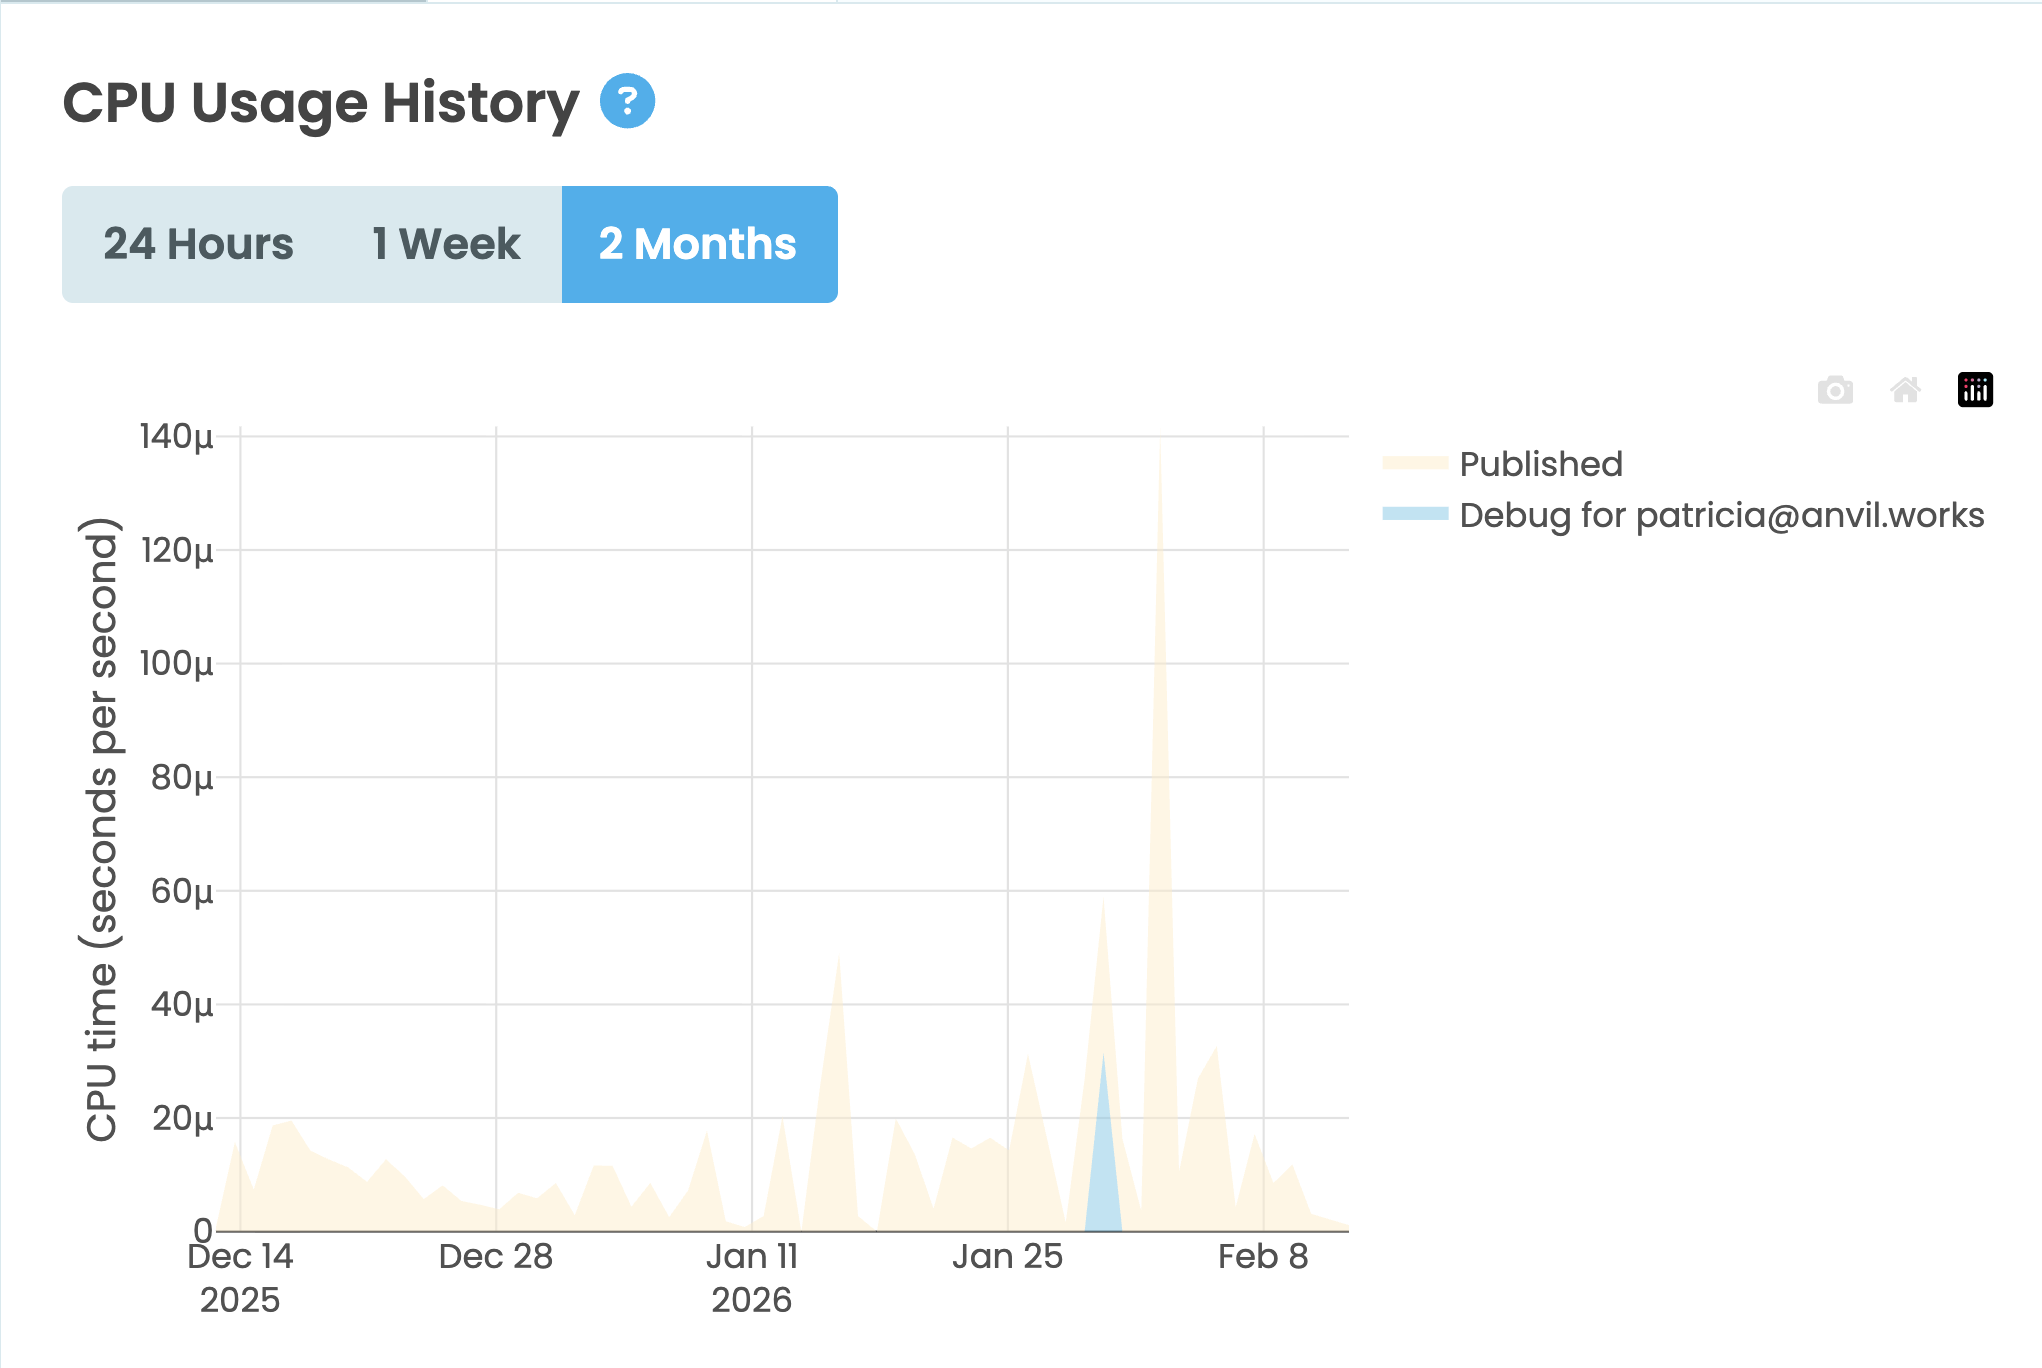
Track CPU and Memory Usage Per App
App Logs now include new CPU Usage and Memory Usage tabs. These charts show how much CPU and memory your app is using over time, with views for the past 24 hours, 1 week, or 2 months. Use them to identify apps that use the most compute and memory.
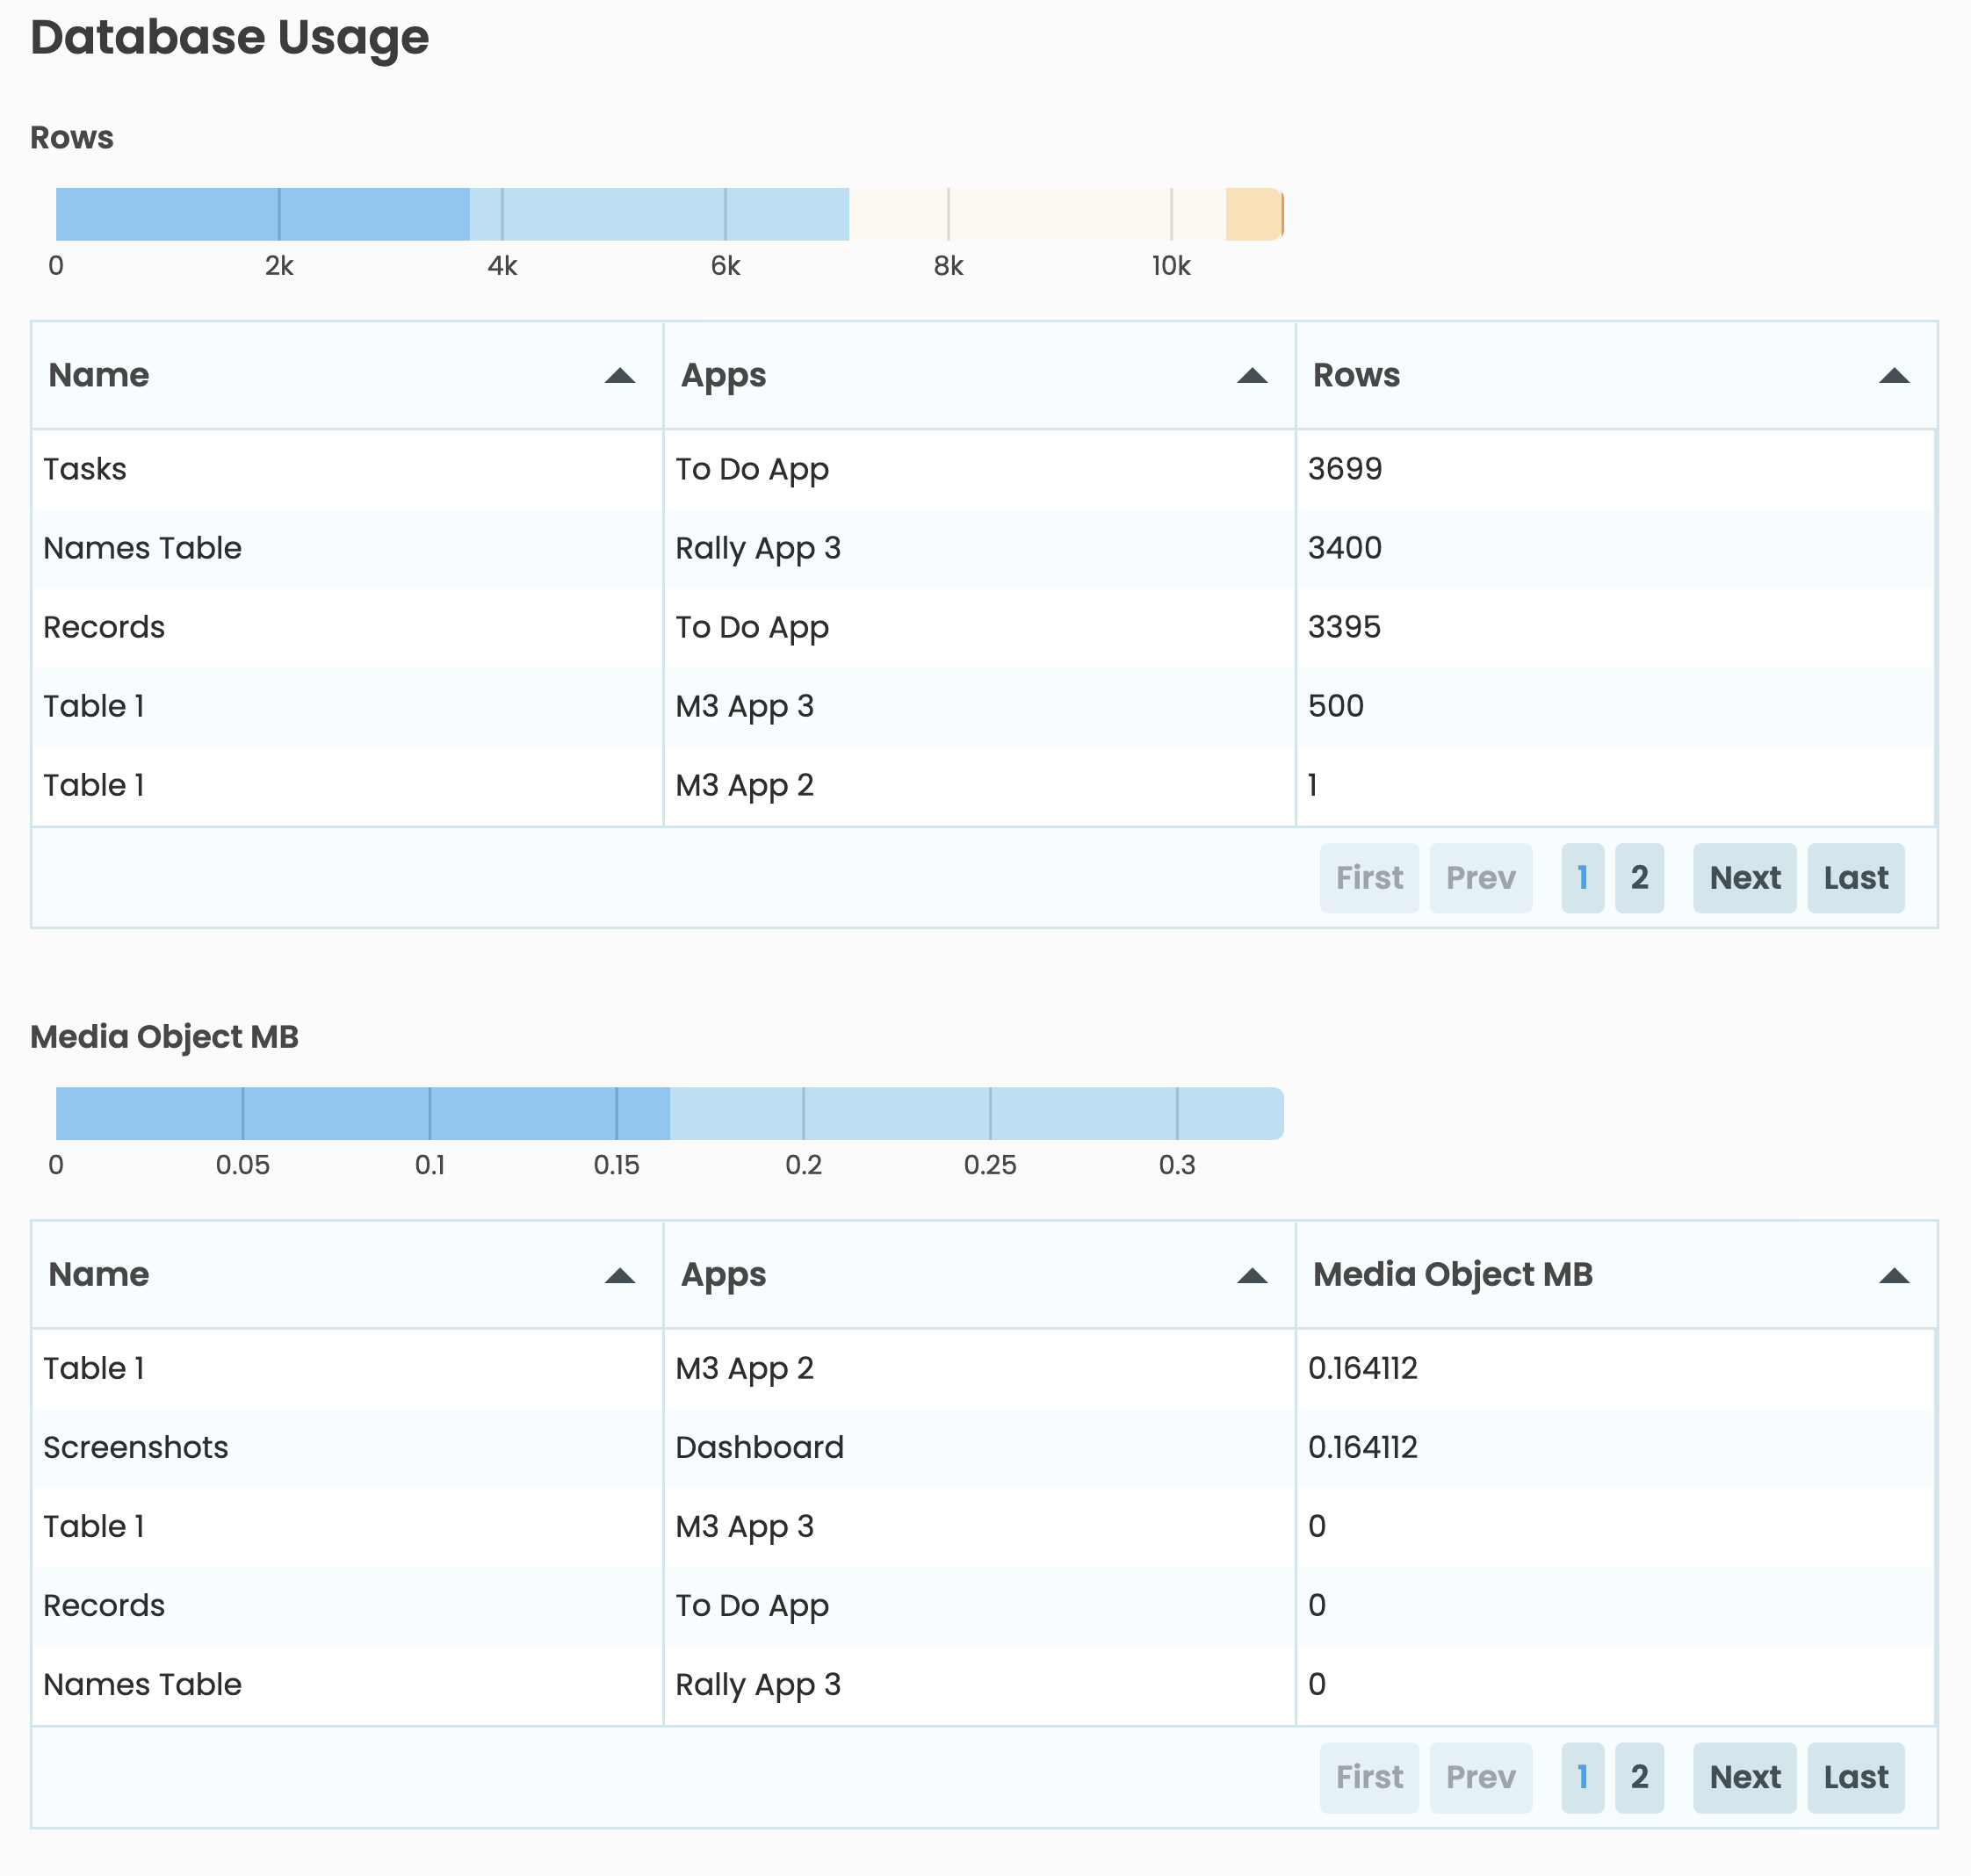
See Resource Usage Across Your Plan
The Account > Quotas and Usage page now shows total compute usage across all apps in your plan, allowing you to select and view app-level compute usage. We’ve also added detailed charts and tables showing how many Data Table rows and how much Media Object storage each app is using, so you can quickly see which apps are consuming the most resources.
Get Started
These features are available now in the Anvil Editor. Open App Logs to see the new CPU Usage and Memory Usage tabs. Visit the Quotas and Usage tab under Account Management to see your plan’s resource overview.
More about Anvil
If you’re new here, welcome! Anvil is a platform for building full-stack web apps with nothing but Python. No need to wrestle with JS, HTML, CSS, Python, SQL and all their frameworks – just build it all in Python.
Want to build an app of your own? Get started with one of our tutorials:
Build Database-Backed Apps
Build a Simple Feedback Form
Build a Simple Feedback Form
Build a data-entry app, and learn the techniques fundamental to building any Anvil app. In this tutorial, you will:
- Build your User Interface
- Write client-side Python
- Write server-side Python
- Store data in a database
- Deploy your app