Say Hello to the Interactive Debugger in Anvil
We are very excited to announce the first release of the Interactive Debugger in Anvil. Say goodbye to countless print statements!
With the Interactive Debugger, you can now pause your code as it executes, inspect variables, and gain deeper insights into what’s happening in your code—whether it’s on the client side or the server side.

What is the Interactive Debugger?
The Interactive Debugger lets you:
-
Add breakpoints to your code to pause execution at specific lines.
-
Inspect variables and values at runtime.
-
Debug both client-side and server-side code, including background tasks and HTTP endpoints.
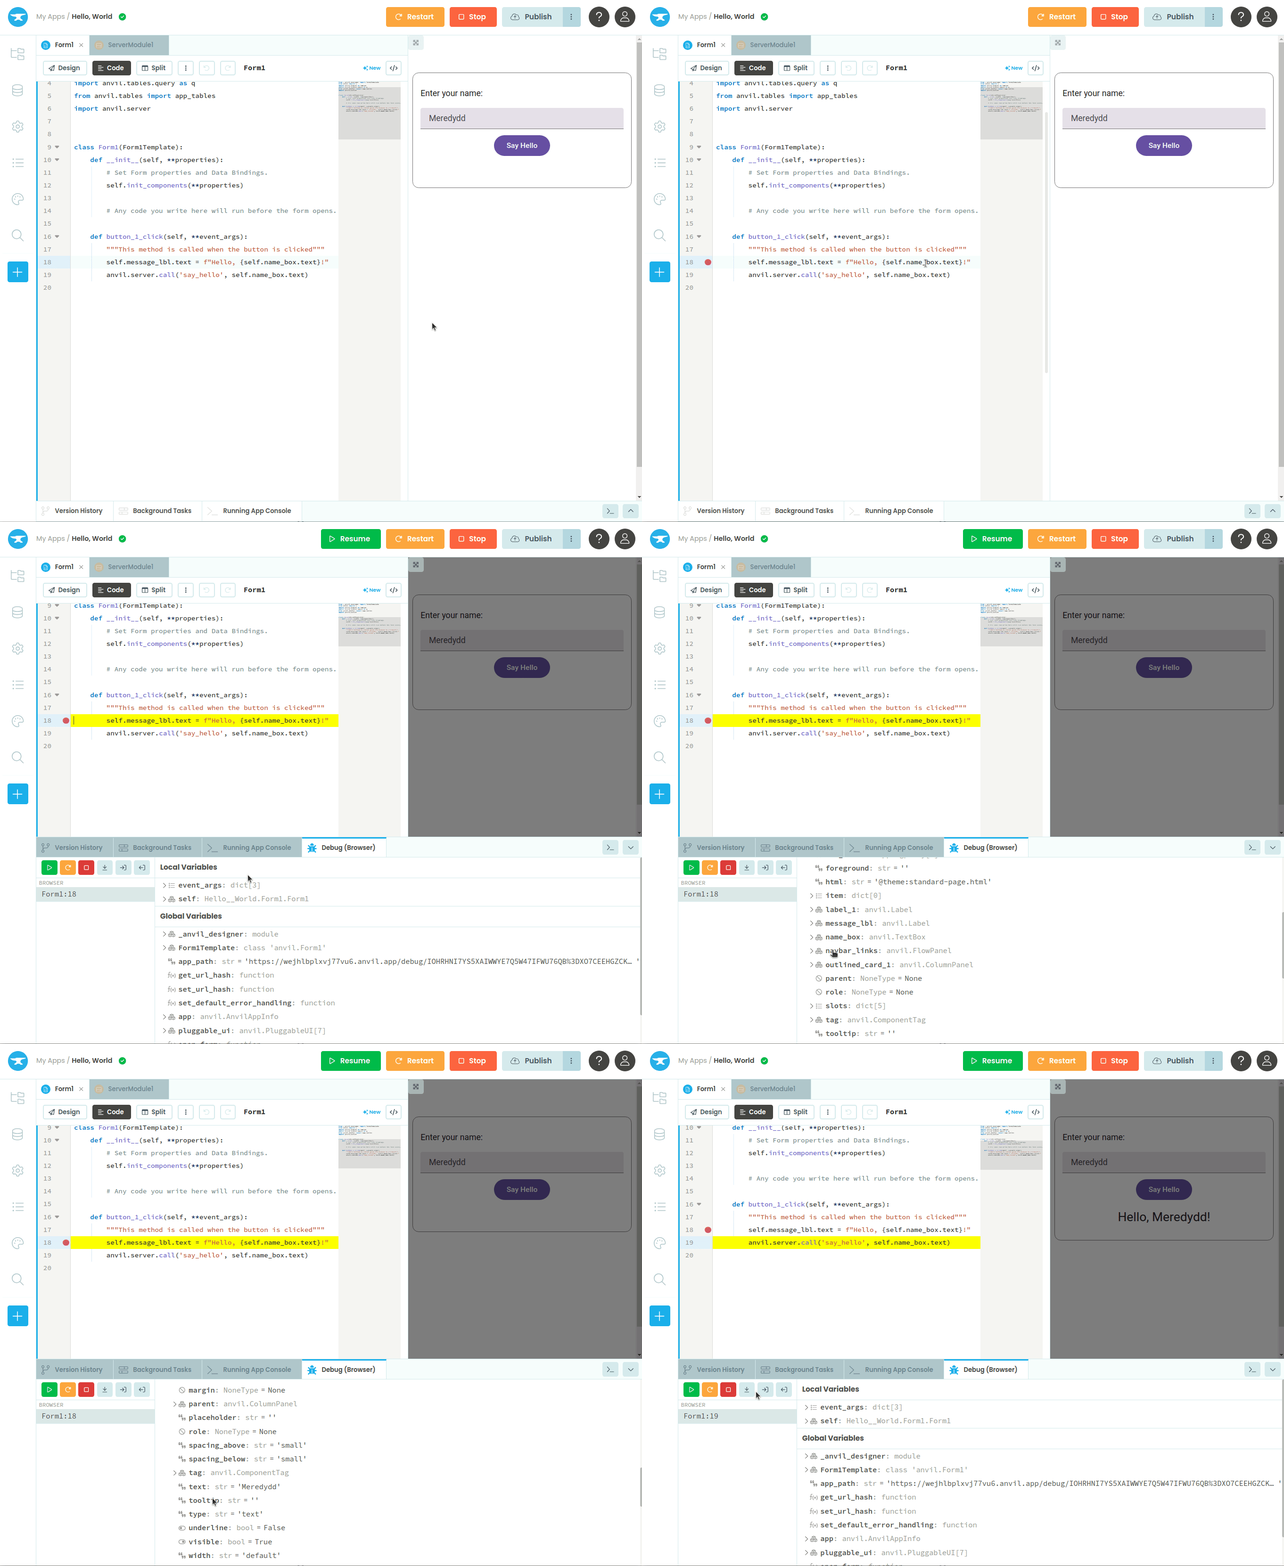
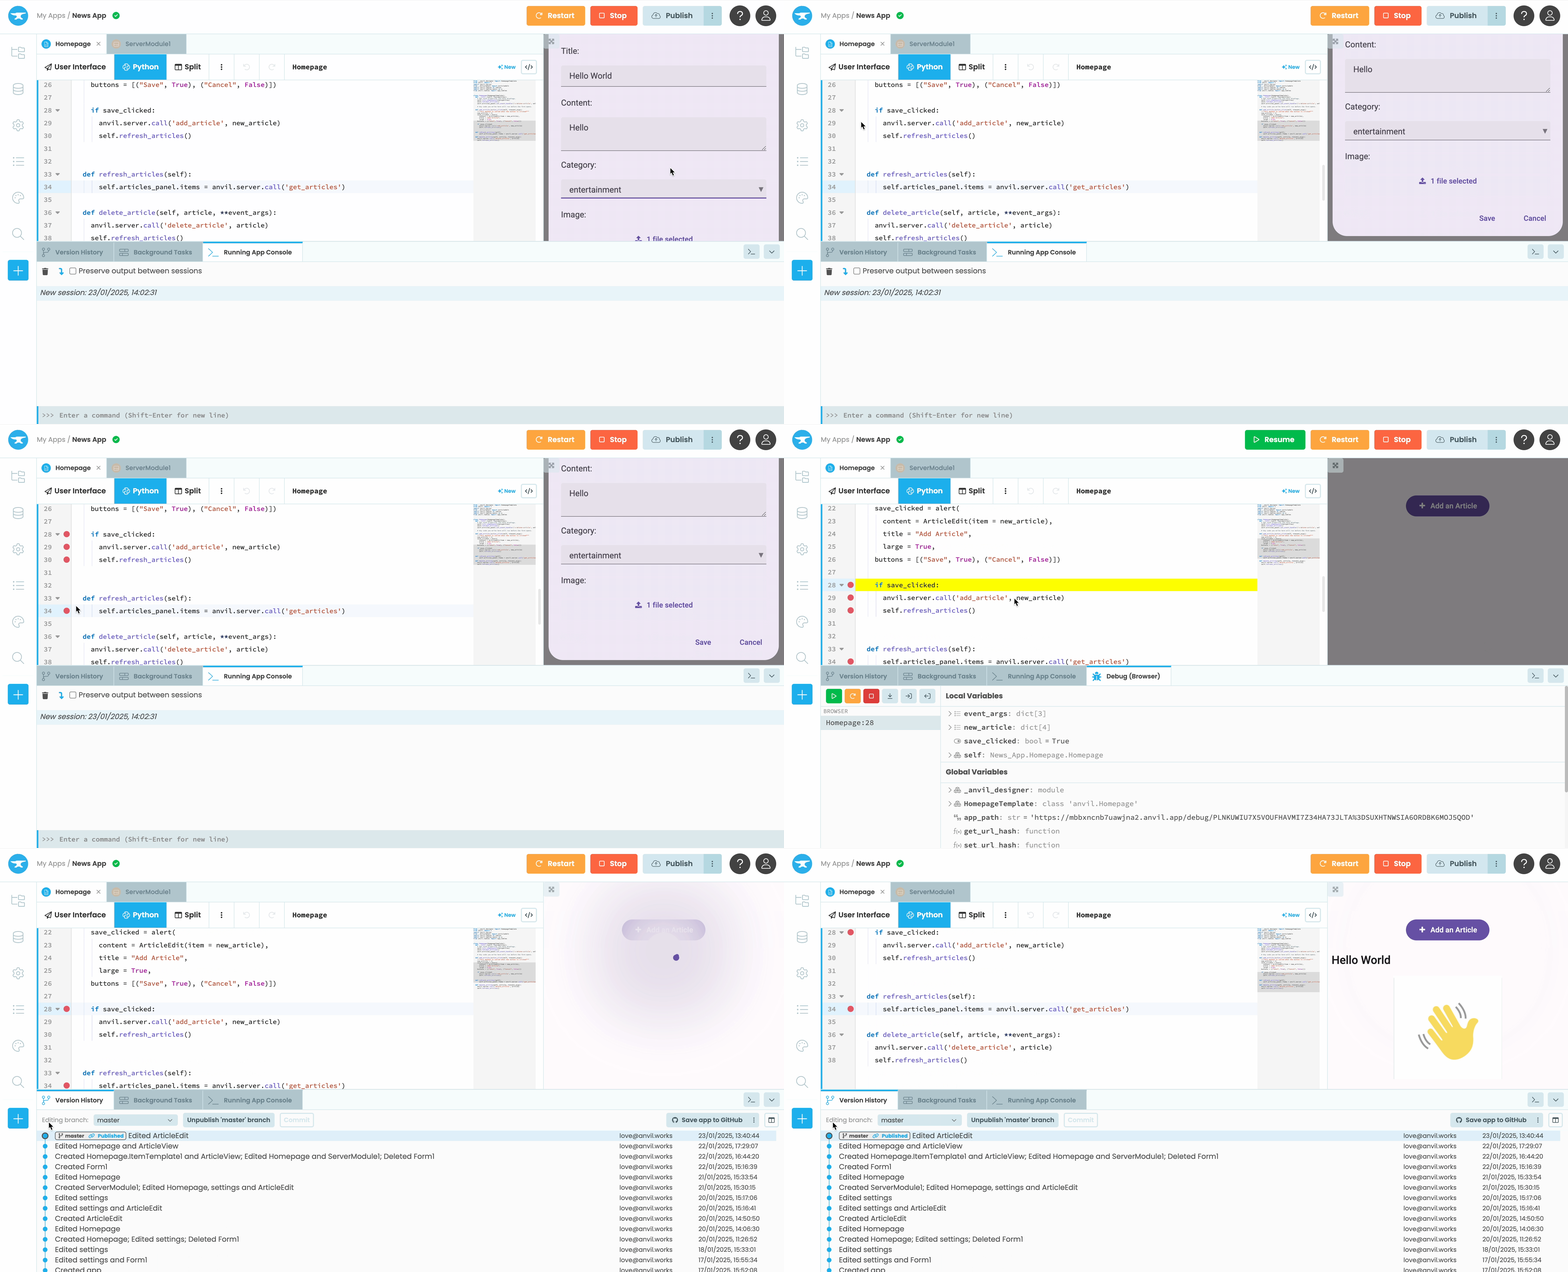
Getting started is simple: just click in the gutter next to any executable line of code to add a breakpoint and then run your code. When this breakpoint is hit, the debugger pauses execution and opens the Debugger Window, where you can easily view and inspect all the variables in your code.
Get Deeper Insights into your Code in real-time
With the debugger, you can add and remove breakpoints even while execution is paused, allowing you to adjust your debugging strategy as needed. The debugger toolbar gives you complete control to resume, restart, or stop execution, step over breakpoints, and step into or out of functions effortlessly. This makes it easy to navigate through your code seamlessly and gain a deeper understanding of its behavior.

Easy Debugging Across Client and Server Code
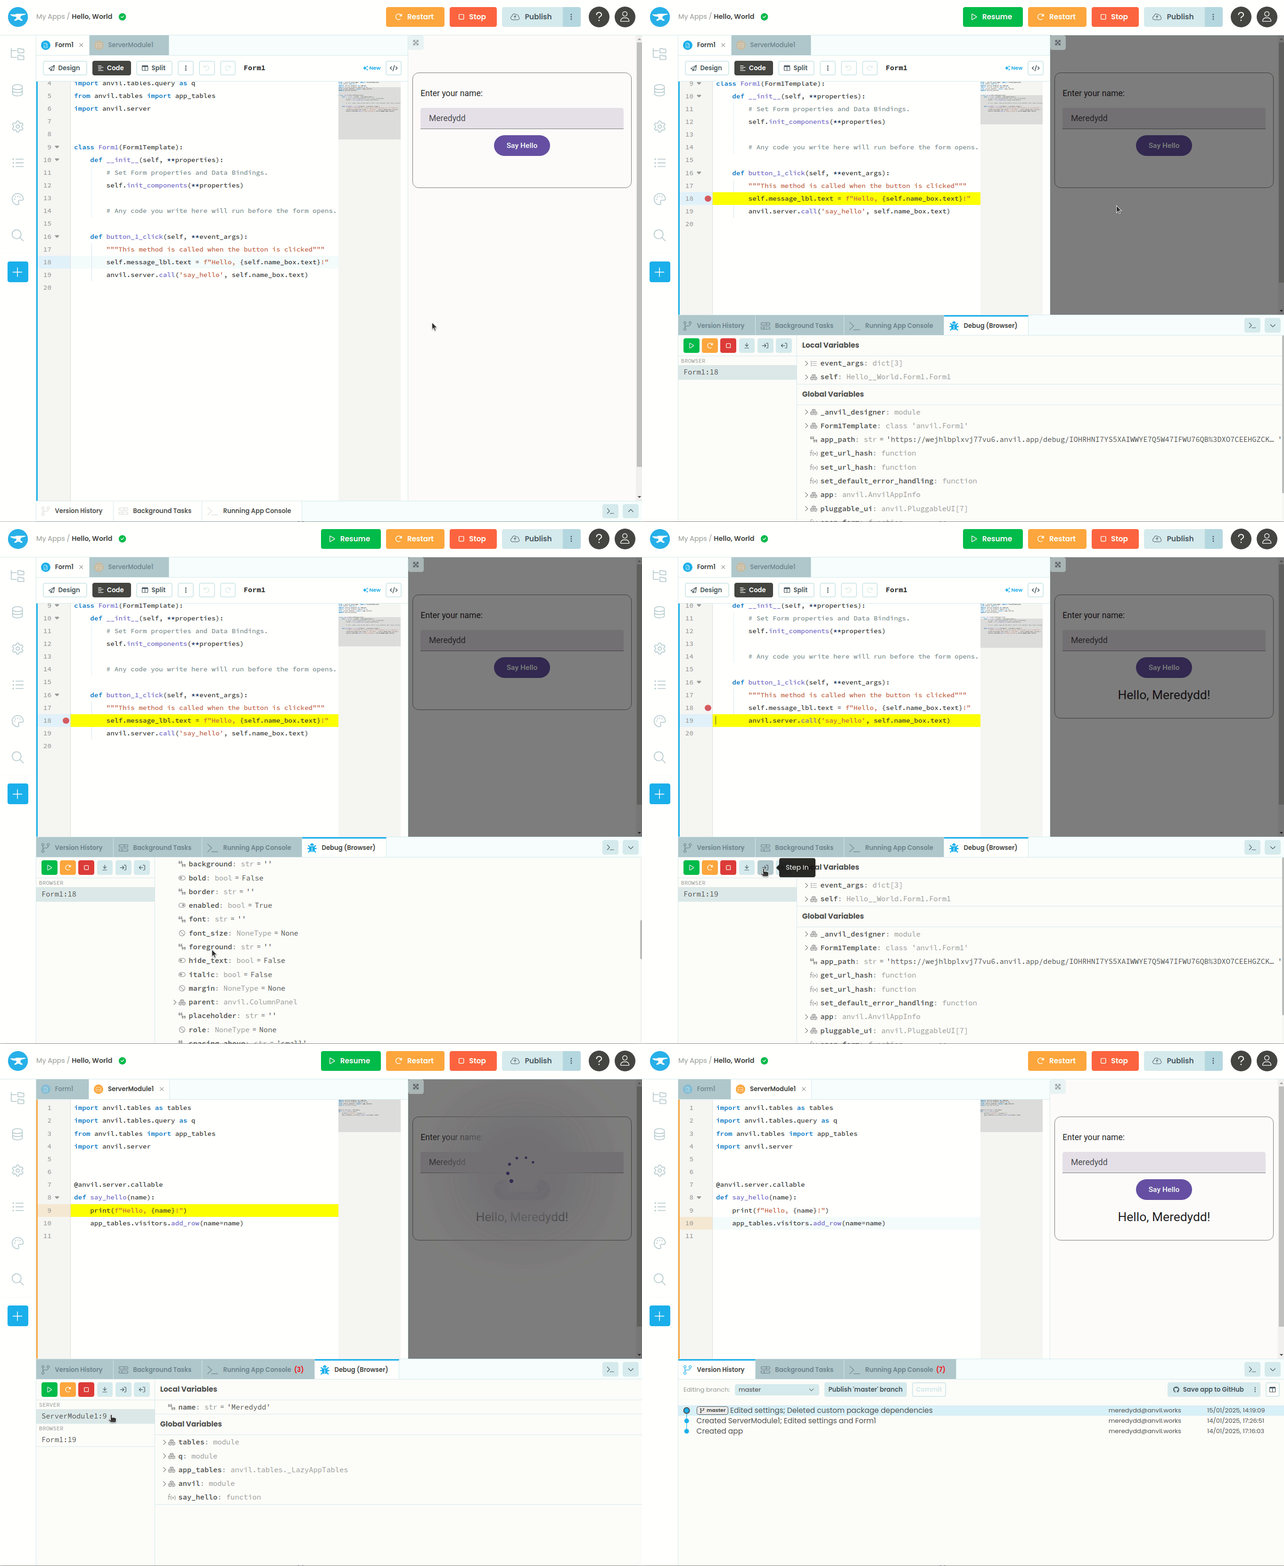
Anvil’s debugger allows you to step into server code directly from client code. For example, you can start in your client-side form code and step directly into your server code while showing the entire call stack on the browser frame.
Here is a demo illustrating how you can step into server code from client code seamlessly:

Debug Background Tasks and HTTP Endpoints
Debugging background tasks and HTTP endpoints in server modules has never been easier. By adding breakpoints to your background tasks or endpoint calls, you can pause execution, inspect variables, and diagnose issues with accuracy and confidence.
Availability
The debugger is available to everyone!
- Free users can use Anvil’s debugger only on the client-side (Form) code.
- Client side and server side debugging is available on a Business Plan or higher.
What’s Next?
This is just the first version of the Anvil Debugger and we have plans for more interesting features, so stay tuned! In the meantime, we will love to hear your feedback! Try out the debugger today and let us know how it works for you.
For a deep dive into debugging with the interactive debugger in Anvil, as well as additional tools to enhance your debugging process, check out our Debugging Documentation.
Happy debugging!
More about Anvil
If you’re new here, welcome! Anvil is a platform for building full-stack web apps with nothing but Python. No need to wrestle with JS, HTML, CSS, Python, SQL and all their frameworks – just build it all in Python.
Want to build an app of your own? Get started with one of our tutorials:
Data Dashboard
Build Database-Backed Apps
Build a Simple Feedback Form
Build a data-entry app, and learn the techniques fundamental to building any Anvil app. In this tutorial, you will:
- Build your User Interface
- Write client-side Python
- Write server-side Python
- Store data in a database
- Deploy your app
 By
By