 By
By Due Date Statistics with Python
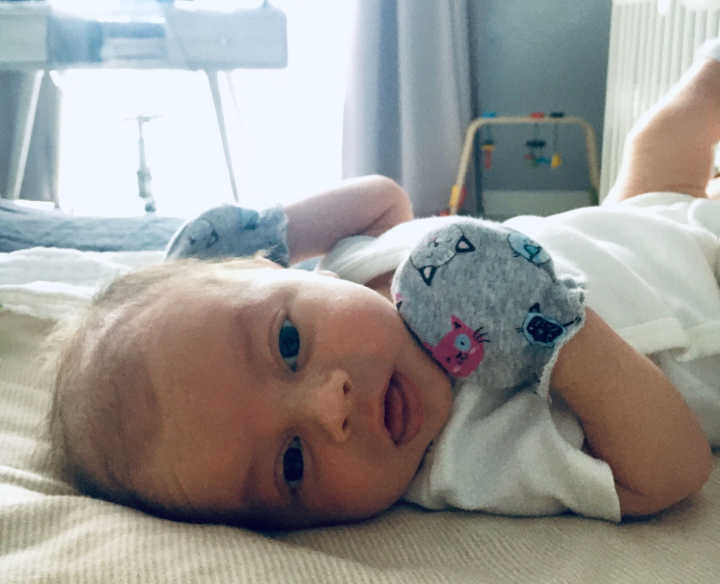
One arrived, two to go – including mine!
So, we’ve now welcomed 33% of the Anvil babies to the world – baby Matthew was born on New Year’s Day! Congratulations to Stu and Vera 🎉
While I’m waiting somewhat impatiently for my own baby to put in an appearance, I’ve been delving into the science of due dates. For my pregnancy-tracking app, I learnt a lot about predicting when a baby will be born. It’s a lot more complex than I knew! So I thought it’d be neat to plot the data out with Python, and make a web dashboard:
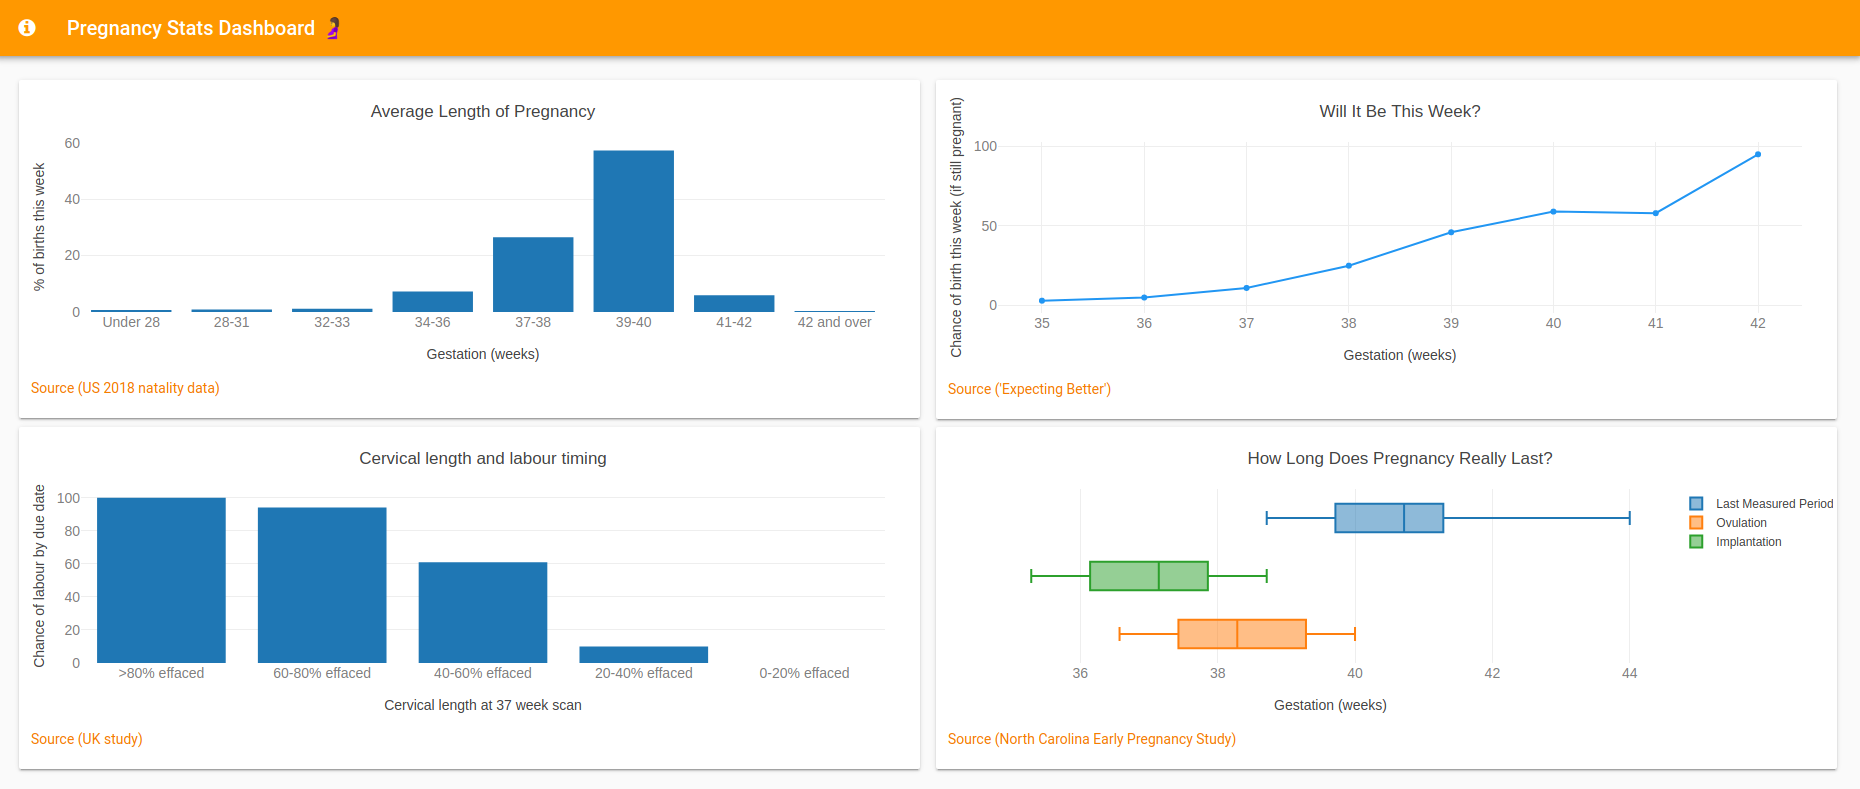
My pregnancy stats dashboard, made with Python, Plotly and Anvil.
The data comes from the US’s National Survey of Family Growth and a couple of interesting studies, and I’ll spend the rest of the post digging into what it means. I processed it into shape with Python, then made a web-based dashboard using Anvil (following this guide to building web-based Python dashboards).
🧐 What do due dates even mean?
My Fruitmoji app lets users track their pregnancy with an emoji each week. But when should it stop tracking? Clearly a year is too long - but does a pregnancy actually last nine months? Nope! Not only that, but it turns out pregnancy is not at all a defined length. Your “due date” is just near the centre of a probability distribution extending a few weeks in either direction.
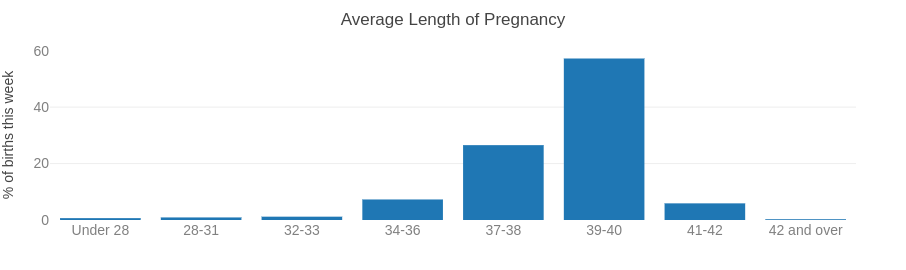
Here’s a graph from my dashboard showing the range of weeks a baby could make its way into the world, based on US birth data.
A normal pregnancy can last from around 37 to 42 weeks, with the official “due date” at the middle of this distribution, 40 weeks.
Looking at overall birth statistics is interesting, but if you’re sitting around at the beginning of the 39th week and baby still hasn’t made an appearance, how much longer are you likely to wait? The excellent book Expecting Better by economist Emily Oster did the calculation for me (again, based on US natality stats). I’ve plotted those probabilities on my dashboard as a line graph:
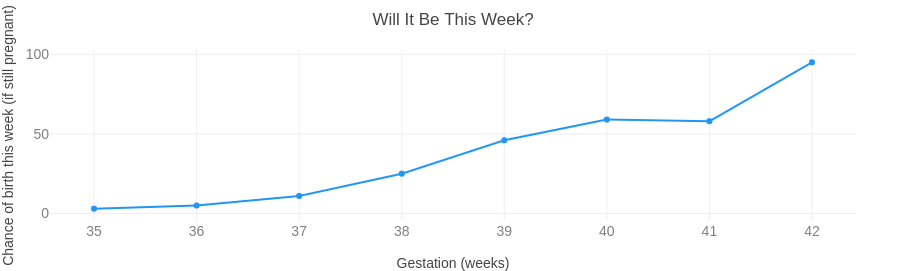
The chance of birth this week, if you’re still pregnant at the beginning of it.
But when will my baby arrive?
We can make some more predictions to narrow things down. First pregnancies tend to last longer than subsequent ones. And your ethnicity also seems to make a difference - women of Asian or African ancestry tend to give birth about a full week earlier than Caucasians.
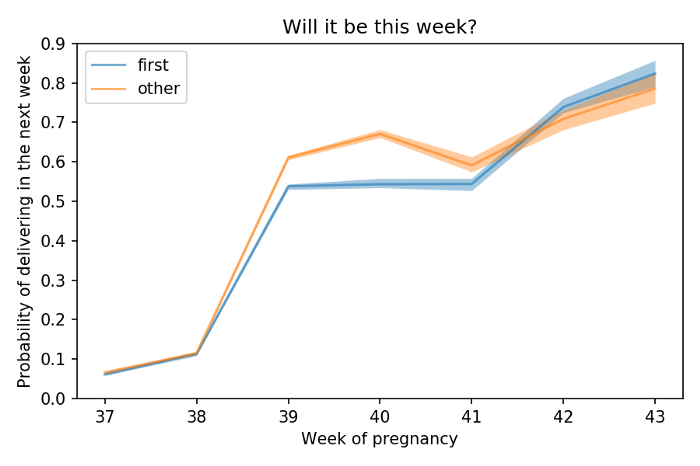
Probability of delivering in the next week, this time split between first and subsequent pregnancies. Graph thanks to Allen Downey and his excellent book Think Stats.
Another thing that can help you work out when your particular baby might emerge is cervical length, something you can find out from scans around 37 weeks. The cervix shortens (“effaces”) as the body prepares for birth. This British study showed a strong link between that measurement and whether a baby arrives before or after the due date. I used Plotly to display the results from the study nicely in my dashboard:
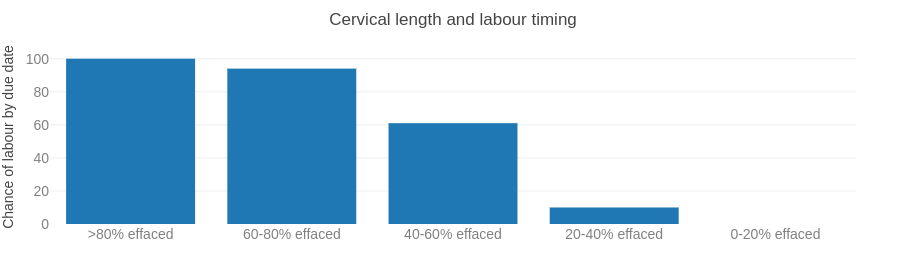
Another plot from my dashboard: effacement (cervical change) vs the chance of giving birth before your due date.
This information can be pretty useful. Emily Oster recounts the story of her friend Heather, expecting her second baby, whose plan was to fly her mother in to help take care of baby number one while she was in hospital. At 37 weeks she was 80% effaced. She took a look at the statistics and moved her mother’s flight up by ten days. Not a moment too soon - her mother landed on Thursday afternoon, and the baby arrived on Saturday night. Data in action!
Induction and overdue babies ⏰
But it’s hard to even gather accurate data these days! Medical induction of labour has actually changed the average length of pregnancies in the USA. Both Allen Downey’s and some of my dashboard’s graphs are based on US data - the National Survey of Family Growth.
This data is influenced by an increase in medical inductions since the 90s. In 1990 (the first year in which it’s included in the national data) fewer than 10% of births followed induction. Today it’s more like 29% of births - a big increase! And inductions before or on the due date are getting more common. So it can be hard to say how long a pregnancy would have continued for naturally - the long tail of the distribution is being chopped off a bit earlier.
Calculating due dates: Which method is most accurate?
There are three main ways to calculate how pregnant someone is - date of last period, conception date, or measurements from an ultrasound scan. Each of these gives an estimated due date for the end of the pregnancy.
Naegele’s Rule
The date of the person’s last period is the standard method of calculation, but it has some problems. Naegele’s Rule for this calculation was invented in the 1800s. Naegele thought each pregnancy lasted 266 days from conception to birth. Conception occurs around ovulation, which occurs around 14 days after the last period. So you can take the first day of your last period and add 280 days (that’s 266 + 14) to get your estimated due date.
This method assumes a ’normal’ cycle of 28 days with ovulation on day 14. If a woman’s pattern is outside of this, her estimated due date will be inaccurate.

Surely we can do better in the 21st century than relying on this guy.
The Naegele calculator code from my app tries to do a little better, by allowing you to tell it the typical length of your cycle, and adjusting the estimate from that:
def due_date_period_adjusted(last_measured_period, period_typical_length=28):
  """
  Use date of last measured period to estimate due date
  (Naegele's Rule)
  """
  due_date = last_measured_period + timedelta(days=280)
  extra_days_to_add = period_typical_length - 28
  due_date = due_date + timedelta(days=extra_days_to_add)
  return due_date
Ultrasound
Using an ultrasound scan to measure the size of the foetus is generally more reliable, but only if it’s done early. The later in gestation you get, the less useful ultrasound measurements are for estimating the due date. There’s a standard “dating scan” that takes place around 12 weeks and is pretty accurate. At that time, the foetus is about the size of a tangerine 🍊.
Sometimes you’ll be given an updated due date after this scan, as it’s known to be more accurate than the basic Naegele calculation.
Knowing the right answer ahead of time
The best way of all, of course, is to already know exactly when the baby was conceived. This fascinating study uses women who had an IVF pregnancy (and therefore knew exactly which day their pregnancies began) to check the accuracy of standard ultrasound measurements. It worked out that standard ultrasound measurements tend to be out by about 3 days from your actual due date. So just using these measurements would mean someone’s classed as ‘overdue’ a little before their real due date arrives.
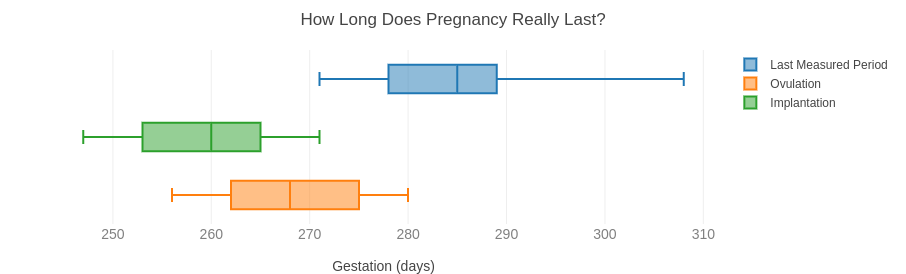
The final plot from my dashboard. The data behind the graph is from the North Carolina Early Pregnancy Study.
Another cool study which took this approach is the North Carolina Early Pregnancy Study, which took daily measurements of women’s hormone levels before they conceived - so the scientists knew exactly when ovulation happened, and therefore how long the babies had been gestating. It showed a huge natural variation in gestation length, especially against the old-fashioned technique of calculating from the last measured period - from 271 to 308 days (that’s 38 to 44 weeks!).
What does this mean for my pregnancy app?
All of this meant that it was important for the Fruitmoji app not to make people feel bad if they go overdue - as we’ve seen, it’s pretty normal. So the app allows you to have a due date in the past, and continues to track ‘overdue’ pregnancies.
The app also supports a few ways to calculate the due date. I set only minimal limits on each DatePicker depending on the calculation being done (so for instance ’last measured period’ can’t be in the future, but it can be more than 40 weeks ago). Then I made my calculations depend only on due_date, so it doesn’t matter how the user arrived at their particular due date.
    # Allow for running over the due date
    self.due_date_picker.min_date = date.today() - timedelta(days=21)
    self.due_date_picker.max_date = date.today() + timedelta(days=280)
The app stops emailing users with updates after the 43rd week of their pregnancy, although most people will probably have unsubscribed before then. The majority of births will have happened by that point, and for the remaining few induction is recommended anyway.
I decided against new dedicated emoji for 41+ weeks (yes, ‘👶’ is the 40+ weeks option!) – at that point, from personal experience, I don’t think anyone needs reminding of how large their baby is!
Learn more 📊
If you’d like to build your own data dashboard, Anvil and Plotly make it easy! You can start with a copy of my due dates dashboard for inspiration:
Build your own app with Anvil
If you’re new here, welcome! Anvil is a platform for building full-stack web apps with nothing but Python. No need to wrestle with JS, HTML, CSS, Python, SQL and all their frameworks – just build it all in Python.
Want to build an app of your own? Get started with one of our tutorials:
Build Database-Backed Apps
Build a Simple Feedback Form
Build a Simple Feedback Form
Build a data-entry app, and learn the techniques fundamental to building any Anvil app. In this tutorial, you will:
- Build your User Interface
- Write client-side Python
- Write server-side Python
- Store data in a database
- Deploy your app