 By
By Telephony integration, deployed in minutes
There are some great telephony services for developers out there these days. A simple HTTP call or webhook is all it takes to send and receive messages, but building and hosting a webapp to do this is still far harder than it should be.
Enter Anvil, a platform for full-stack web development in nothing but Python. An SMS survey is a great example of something that should be really simple to build, so I’ll show you how I did it in just a few minutes with Anvil.
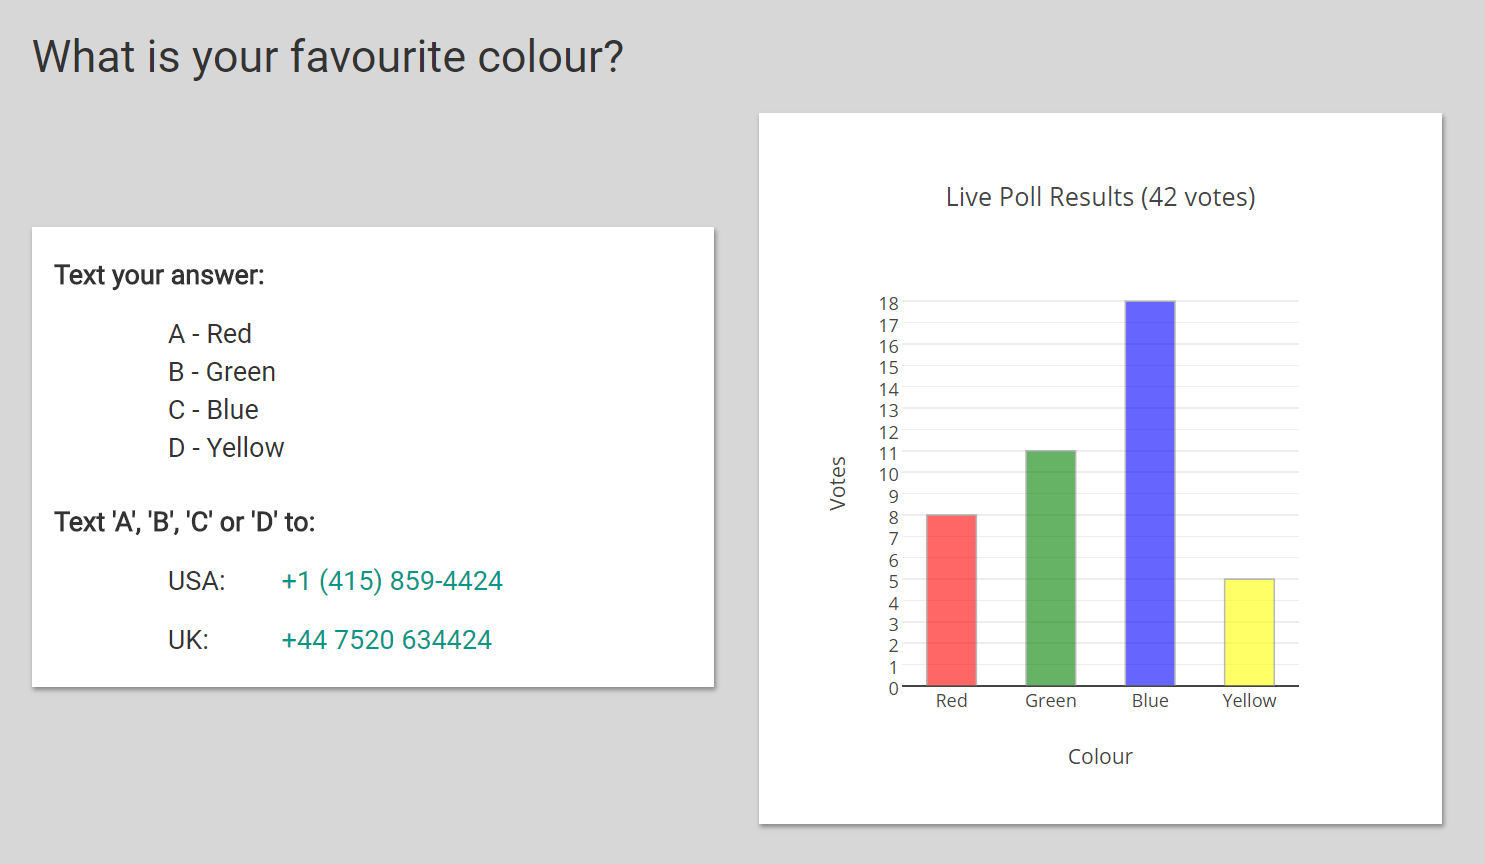
First, head over to https://sms-poll.anvilapp.net to see the finished app. You can also take a look at the source code and try it out yourself.
Let’s take a quick tour through the code to see the highlights. There are two main parts:
-
The main form, displaying voting instructions and current live survey results.
-
The
WebhookServer Module where you’ll find the HTTP endpoint that can be called for each incoming SMS. I used the excellent Nexmo API, which makes it really simple to receive SMS messages to a custom webhook.
Receiving SMS Messages
Take a look at the Webhook Server Module. You’ll see that it only took one function to handle incoming messages:
  @anvil.server.http_endpoint("/sms")
  @tables.in_transaction
  def incoming_sms(msisdn, text, **kw):
    ...
The incoming_sms function is decorated with @anvil.server.http_endpoint, which means external services can make HTTP requests that trigger the function call.
After signing up with Nexmo, I simply set the incoming webhook address to the URL of my HTTP endpoint. In my case, that URL is
“https://sms-poll.anvilapp.net/_/api/sms” – your copy of the app will have its own URL, which you can find displayed at the bottom of the Server Module.
HTTP form parameters are passed as keyword arguments to this function. We have explicitly captured the sender (msisdn) and contents (text) of the message, and
used **kw to receive the other paramaters. In fact, form parameters, query string parameters and path parameters are all provided as keyword arguments – see the
documentation for more information.
Inside the incoming_sms function we add a row to our data table with the details of the incoming message:
app_tables.messages.add_row(sender=msisdn, time=datetime.now(), message=text)Next we decide whether the incoming message contains a valid vote, and if so increment the appropriate total in the Results table.
    colours = {
      "A": "Red",
      "B": "Green",
      "C": "Blue",
      "D": "Yellow",
    }

    colour = colours.get(text.upper(), None)
    if colour is not None:
      app_tables.results.get(colour=colour)['votes'] += 1
Readers of a nervous disposition should note that the entire incoming_sms function is decorated with @tables.in_transaction, so operations like
incrementing values in the database are perfectly safe. If two requests arrive simultaneously, and they try to edit the same table row, one of them
will be automatically rolled back and retried. See the Data Tables documentation for more details, and
the Data Tables tutorial for examples.
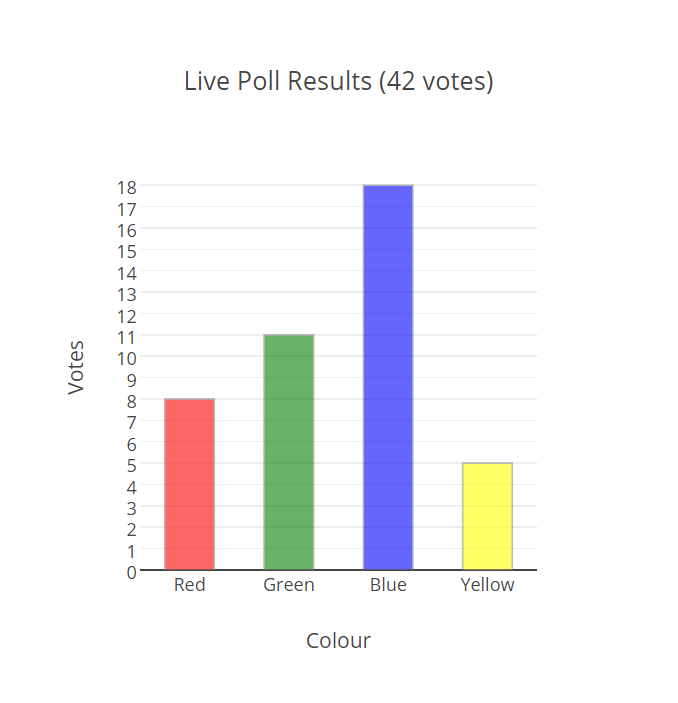
Displaying poll results
Laying out the UI for our web application takes no code at all – Anvil’s visual designer lets you drag and drop components into place until your
page looks the way you want it to look. For this app, we’ll add a few containers and labels, and a Plot component for displaying the chart.
Plot component, we have the full Plotly API at our fingertips. Drawing a bar chart couldn’t be easier.
Back in the main form, we query for the latest results:
results = list(app_tables.results.search())Then it’s just a matter of creating a Plotly Bar Chart object, and populating it with our results. Notice that we use list comprehensions to assemble the necessary data for each axis:
  # Create a Plotly Bar chart with colours along the x-axis
  # and number of votes on the y-axis.
  self.results_plot.data = go.Bar(
    x=[v['colour'] for v in results],
    y=[v['votes'] for v in results],
    width=0.5,
    opacity=0.6,
    marker=dict(
      # Set the colour of the bar to the colour being voted for
      color=[v['colour'].lower() for v in results],
      line=dict(
        color="#888",
        width=1
      )
    )
  )

  # Set the axis and plot labels
  self.results_plot.layout = go.Layout(
    yaxis=go.YAxis(
      title="Votes",
      # Start y-axis ticks at 0 and increment by 1.
      tick0=0,
      dtick=1
    ),
    xaxis=go.YAxis(
      title="Colour"
    ),
    title="Live Poll Results (%s votes)" % sum([v['votes'] for v in results])
  )
The final piece of the puzzle is to make the chart update live. For this we use a Timer component on the form, and set its interval to 1 second. In the
tick event handler, we simply call the method to redraw the plot.
Ready to go
And there you have it. A complete SMS polling app, built and deployed in no time. Anvil lets you build great apps on top of great APIs (like Nexmo) without any of the hassle traditionally required for web development.