 By
By Statistically Modelling Conference Swag at PyCon 2019
Sponsoring a conference has many challenges, and one of them is making sure you don’t run out of T-shirts!
In his popular lightning talk at PyCon 2019, Meredydd described how we use SciPy to model the distributions, and minimise our chances of running out: Scroll down for a transcript

For more information about Anvil, check out anvil.works
Transcript:

Hi! My name is Meredydd, and I run a startup called Anvil. We make tools for building full-stack web apps with nothing but Python, and we are sponsoring PyCon again this year. It’s great to be back!
Like any good sponsor, we give out T-shirts — specifically, to anyone who builds an app with Anvil and shows it to us at our stand.
There are two problems with this. For one, Cleveland is a long way from home, and all these T-shirts have to come with me in a very heavy suitcase.
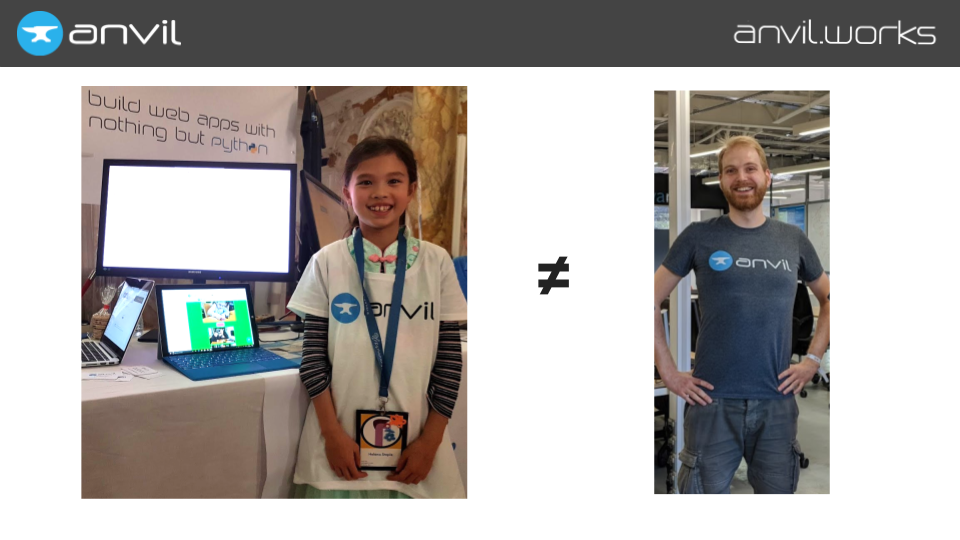
Problem number two: Python developers, it turns out, come in many different shapes and sizes. Pictured here are two Python programmers: a shirt that fits the one on the left is going to look pretty undignified on the one on the right.
So, the question is, “how many shirts should we be bringing of each size?”
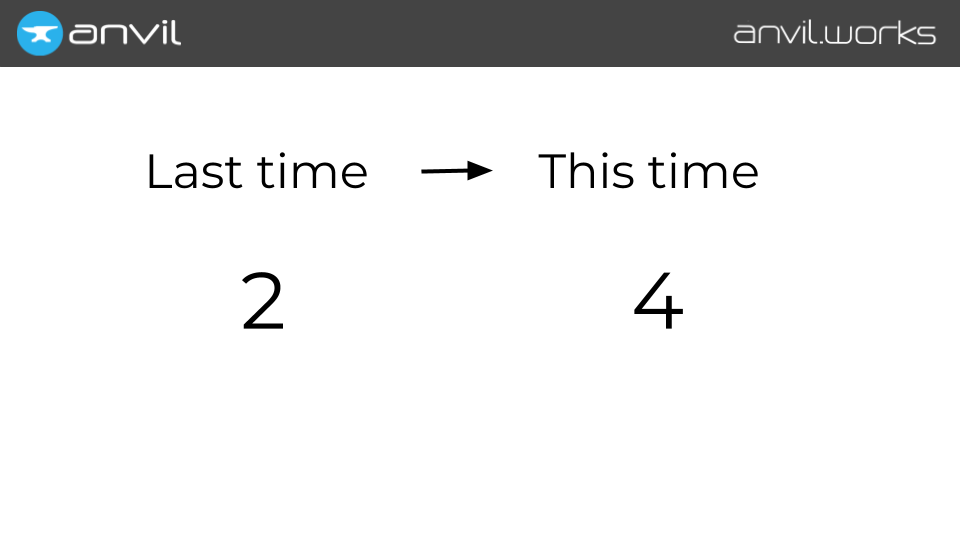
We’ve been here before, so we could just bring twice as many of each size as we gave out last year.
Last year, we gave out two women’s-cut extra-small shirts, so perhaps we should bring four this year. That seems plausible.
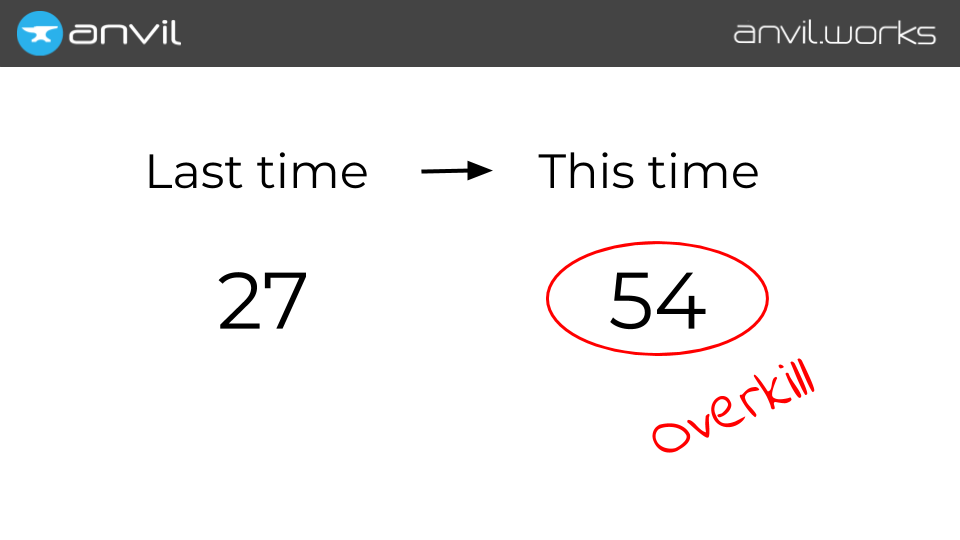
But last year, we gave out 27 men’s large shirts. If we brought 54 of them this year, that would definitely be overkill.
If you think about it, that 54th men’s large shirt is much, much less likely to get used than that 4th women’s extra-small.
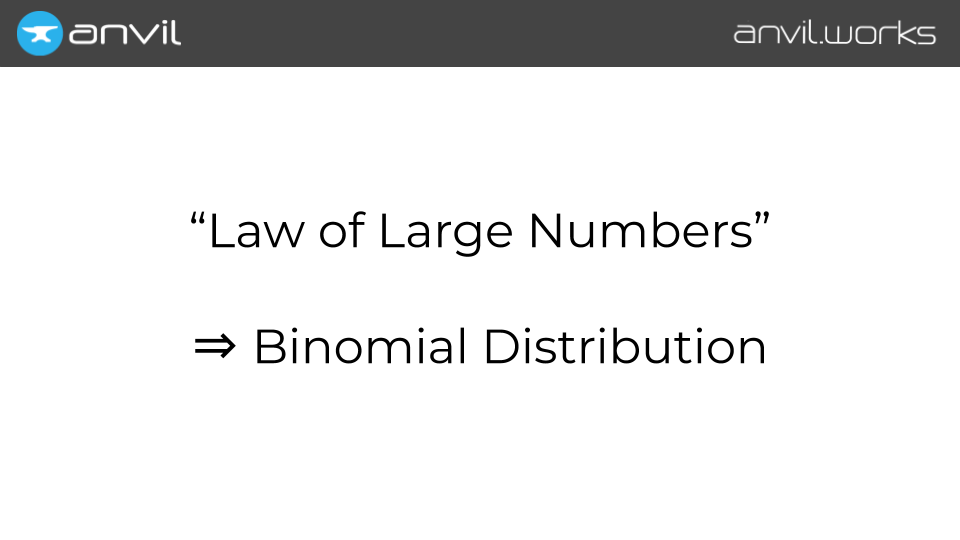
It’s the Law of Large Numbers: If you’ve got a larger sample size, it will average out more reliably.
We can model this with a binomial distribution. Imagine we’re rolling 3,500 dice — one for each person at PyCon — and then counting up how many rolled “Men’s Large”.
Thankfully, SciPy has a function for calculating this distribution, and so I’m going to use it to write an interactive tool for exploring this distribution.
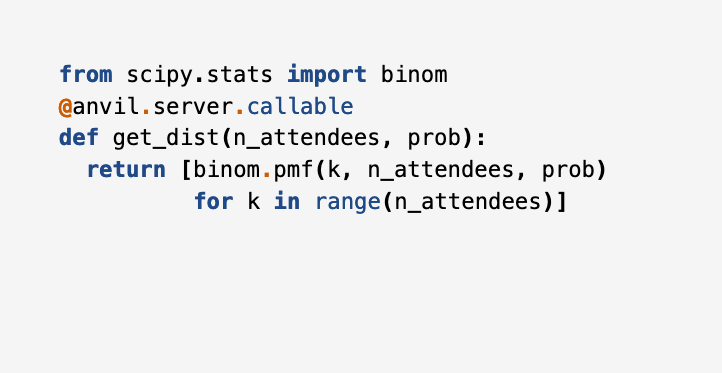
I’m going to write a function that gets the probability distribution for a given number of attendees, and a given probability of each attendee claiming a particular size of shirt.
At this point, the live-coding begins. Open the source code to follow along:
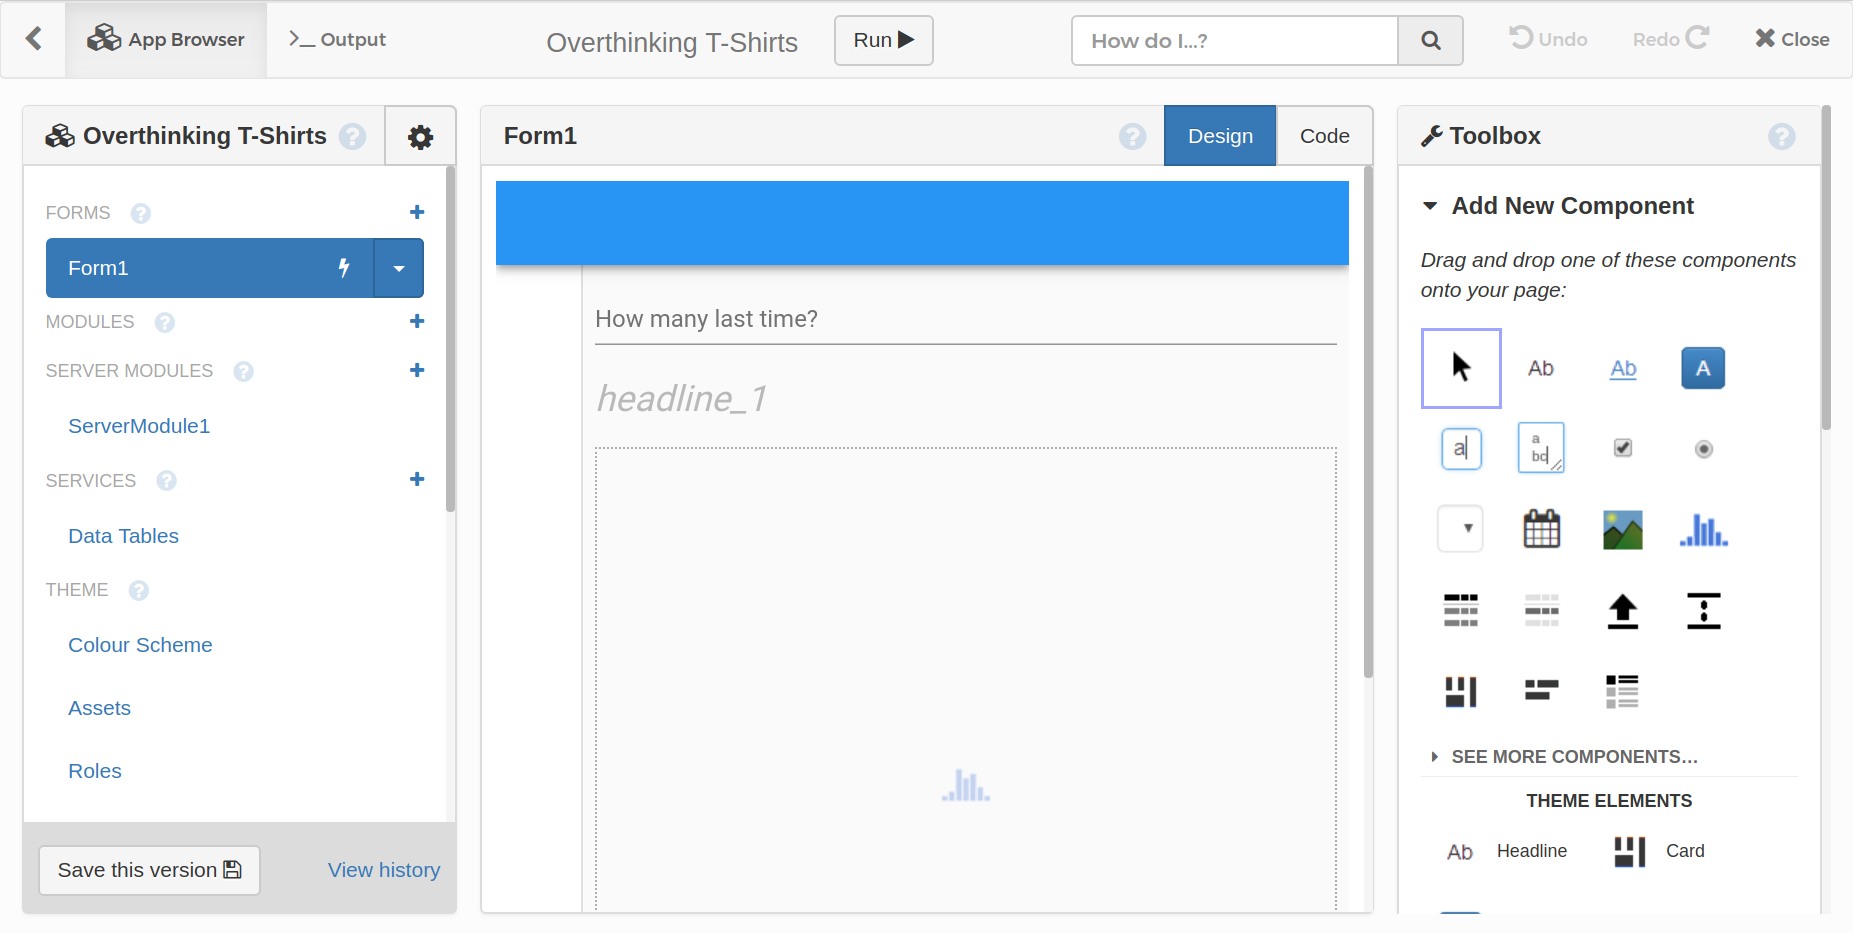
Now we have our distribution, we can make an interactive tool to explore it.
Our user interface will have a text box where we can enter how many of this size of shirt we used last time; and then underneath it will be a plot so we can explore the distribution.
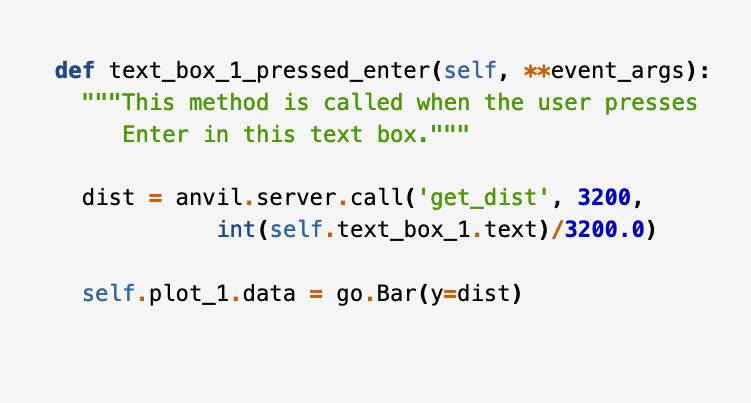
When you hit Enter in this text box, we’re going to call that get_dist() function we defined earlier. The number of attendees is 3,200, and we can estimate the probability from the number we gave out last time, because that was also out of a population of 3,200
Once we’ve got that distribution, we can plot it as a bar chart.
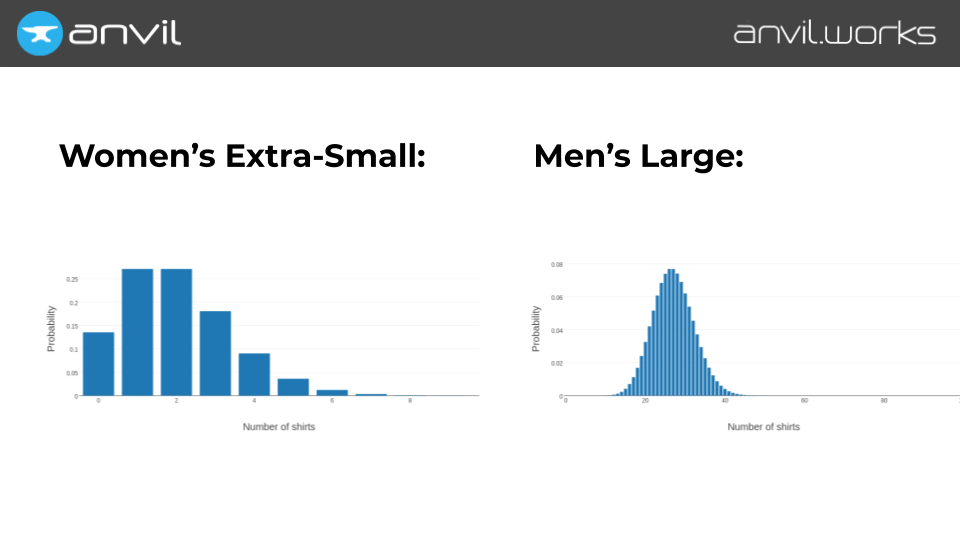
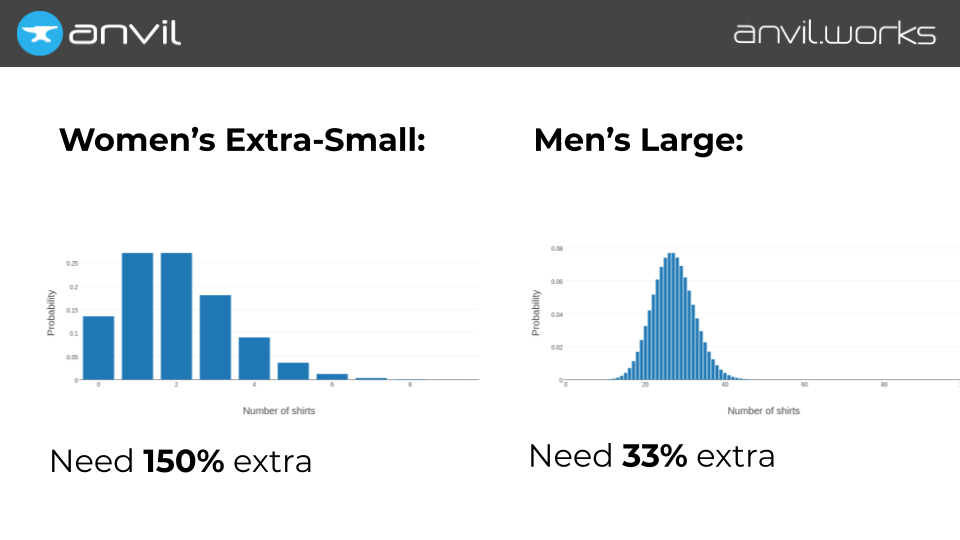
When we plot the women’s extra-smalls, the distribution is actually quite wide. Of course, we’re most likely to need two shirts, same as last time. But we could easily need twice that number, or even more.
Whereas if we check out the men’s large shirts, the distribution is a lot tighter. Still, again, most likely to need 27, same as last time, but we’re vanishingly unlikely to need twice that number.
Now, we’ve constructed a statistical model that can actually answer our question. We want to know how many shirts to bring, to avoid running out.
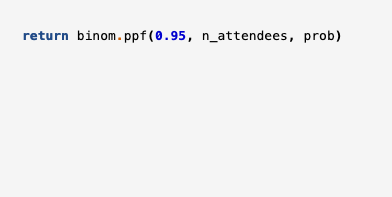
What we want to do is to find a number of shirts such that there is a 95% probability of needing that number or less. This is the 95% point of the probability distribution, and SciPy provides a function for calculating this: binom.ppf().
So we calculate the 95% point for the probability distribution of every size of shirt, and that’s how many shirts we bring.
We wire this up in the UI, to display the number of shirts.
We see that for the women’s extra-smalls, we need 5 shirts – more than double the number we gave out last year – to be 95% sure of not running out.
Whereas for the men’s large shirts, we need 36 – that’s only 33% more than last time.
You can get the source code of the app I’ve just built here:
And if everyone in this hall comes to our stand, builds an app, claims a T-shirt, and completely cleans us out?
Well, at least that’ll show the statisticians. Thanks very much!