
Comparing Streamlit to Anvil
If you’ve built apps with Streamlit, you’re probably used to building your UI in code, and running everything in a top-to-bottom script. Anvil is different — it’s an IDE and hosting platform for building full-stack web apps entirely in Python.
Unlike Streamlit, Anvil doesn’t abstract away the fundamental way that web applications work, it just makes it a lot less complicated. In Anvil, you build your user interface with a drag-and-drop designer, and there’s a clear separation between client-side and server-side code.
This guide explains the key differences between Streamlit and Anvil, and helps you translate a Streamlit app into an Anvil app.
Key Differences
| Feature | Streamlit | Anvil |
|---|---|---|
| Platform | Python package you run in your own environment | Full IDE and hosting platform |
| UI Creation | Built from Python code | Drag-and-drop designer (or from Python code) |
| User Interaction | Script runs top-to-bottom on each interaction | Event-driven (run functions when something happens) |
| Code Execution | Everything runs on the server | Code runs in browser and server |
| Customisation | Custom CSS/JS is tricky | Easy access to CSS, JS, custom HTML |
| Database | Connect to external database | Use built-in or external database |
| Deployment | Requires extra setup | Click a button |
Core Concepts
Where does the code run?
One major difference between Streamlit and Anvil is where your code runs.
In Streamlit, all code runs on the server. UI elements are just Python function calls that Streamlit renders to the webpage. When a user interacts with the UI, Streamlit re-runs the entire script to update the interface. This works well for small apps, but it means:
- Every interaction requires a round trip to the server
- You can’t directly access browser features (e.g. JavaScript APIs, instant UI updates)
- Managing state between interactions can get messy
Anvil apps have two kinds of code: client code, which runs in the browser, and server code, which runs on the server. Client code is what renders your app’s UI and makes it interactive. Because it runs in the user’s browser and requires no roundtrips to the server, it’s lightning fast. Server code is for data processing, using Python packages, querying databases and other code that needs to be secure.
Separating client and server code means:
- Faster response times for UI interactions
- Access to browser capabilities (e.g. changing elements instantly, working offline, calling JS)
- Better separation of concerns (UI in the browser, heavy lifting on the server)
In Anvil, you can write functions in a Server Module that will run on a secure server but call them from client code. You do this by decorating your server function with @anvil.server.callable then using anvil.server.call() from client code.
#a function in a server module that will run on a secure server
@anvil.server.callable
def get_data():
    return app_tables.my_data.search()
#call the server function from client code
@handle("data_button", "click")
def data_button_click(self, **event_args):
data = anvil.server.call("get_data")
print("My data: ", data)Building UIs
In Streamlit, the User Interface is generated from a Python script that runs top to bottom. UI elements are Python function calls. For example, if you want a title on your page, you just add st.title("My App") to your script.
In Anvil, you use the drag-and-drop designer to build your UI. Building your UI visually makes it easier to lay out your page and make adjustments to the look and feel of your app.
Building a UI by dragging and dropping components
All components in Anvil are Python objects that have methods and properties to define how they look and behave. You can adjust these properties from the designer or in code.
Because the UI components are Python objects, you can also instantiate them entirely in code. You just need to create an instance of the component then add it to a container component.
#create an instance of a Button component
submit_button = Button(text="submit")
#add that Button to a container so that it appears on the page
self.content_panel.add_component(submit_button)
User Interaction
When a user interacts with a Streamlit app, the entire Streamlit script reruns from top to bottom. This means that in Streamlit, you don’t need to tell it which code to run and when. While this simplifies things, it means that Streamlit apps can be slow, and it makes it difficult to manage state.
Anvil works differently. In all web applications, interactive UI elements fire “events” when a user interacts with them. For example, a button will fire a “click” event when clicked. In traditional web development, you would set up an event handler using JS to run a function whenever the “click” event fires. Anvil doesn’t reinvent this process, but makes it more Pythonic.
In Anvil, methods in your UI code decorated with @handle("<component-name>", "<event-name>") are event handlers. You can create an event handler by writing a function that has **event_args as an argument and decorating it with @handle("<component-name>", "<event-name>"). You can also select a component and add an event handler from the UI designer. This will automatically set up an event handler method for you. You then add the code you want to run when the event fires to that function.
This way, Anvil doesn’t need to re-run all of your code, it only runs the function that was triggered by the user interaction.
Storing Data
Because a Streamlit app is just a Python script, you can connect to any external database that has a Python API.
You can do the same in an Anvil Server Module. However, Anvil also has a built-in database built on top of PostgreSQL. You can use our built-in database, called Data Tables, to store data directly in your app, then use Anvil’s app_tables API to access your data in Python.
Publishing apps
If you want to deploy your Streamlit app to the web, you can set up a cloud server yourself, or use Streamlit Community Cloud for free. Using Streamlit Community Cloud requires some set up and deployment takes several minutes. Your app will also go dormant if not used for some time. This means that if a user tries to interact with your app again, they will have to wait a few minutes for the app to boot up again.
Anvil allows you to deploy your app to the cloud instantly. You just need to click Publish from within the Anvil Editor. If you don’t want to deploy your app on Anvil’s own servers, you can use the Anvil App Server to set your app up on your local machine or another cloud service.
Customization and styling
Streamlit apps can be hard to customize, and as a result, they all tend to look the same.
Anvil components have properties that allow you to change how they look without touching any CSS code. However, if you want more control over the look and feel of your components, you have access to your app’s CSS files where you can add classes and change styles.
You don’t need to know HTML to build an Anvil app, but if you do want to build components or pages from scratch, you can.
Migrating from Streamlit to Anvil
In this part of the guide, we’ll show you how to translate an existing Streamlit app into an Anvil app.
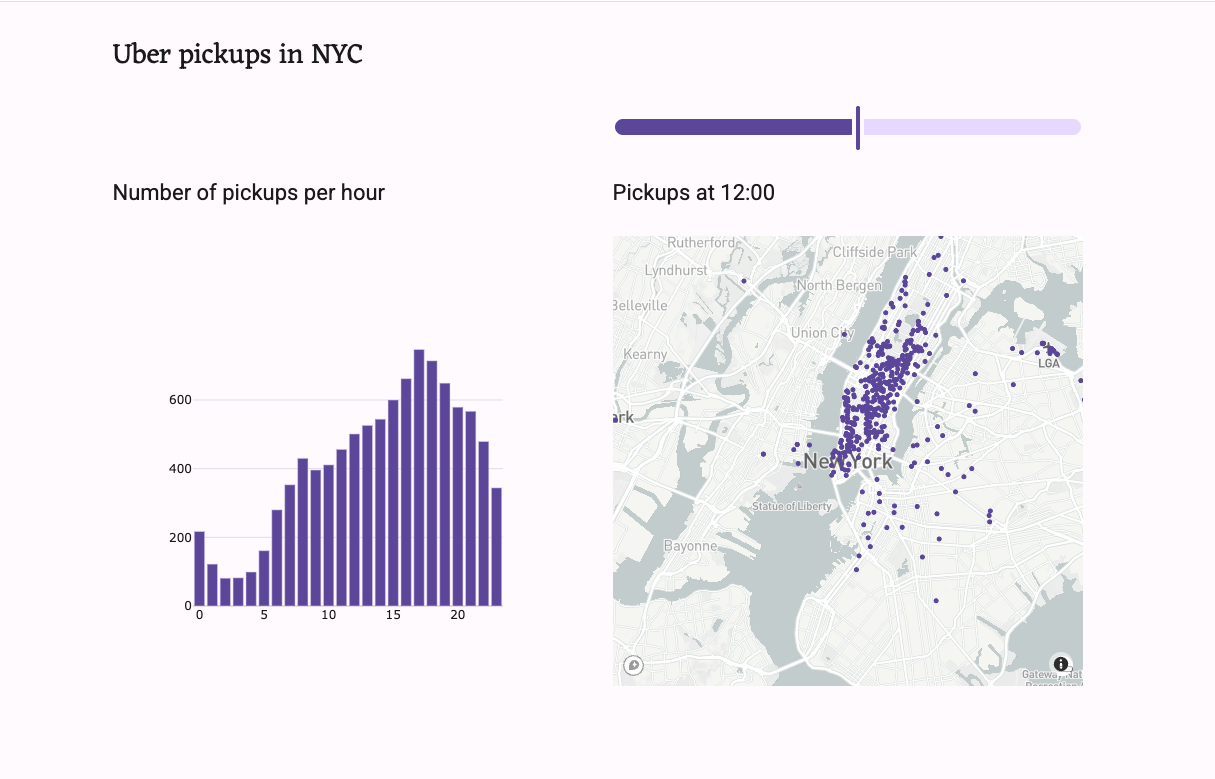
Here’s a simple dashboard app built in Streamlit. It imports data on Uber pickups in NYC in 2014 and plots the number of pickups per hour in a bar chart and a map.
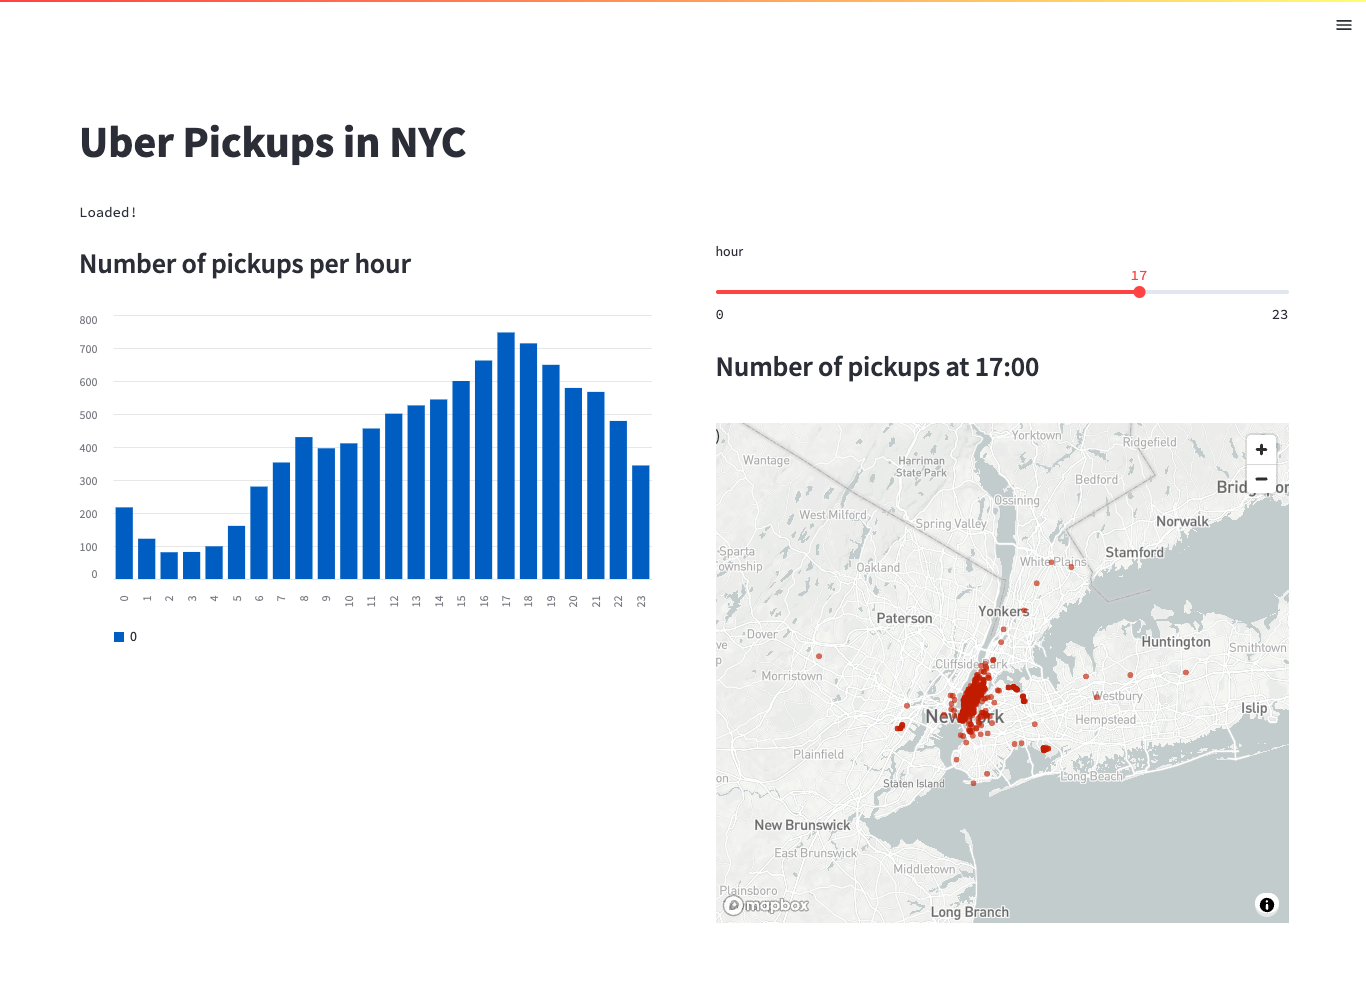
Here is the script that runs this app:
import pandas as pd
import numpy as np
import streamlit as st

st.set_page_config(layout="wide")

st.title("Uber Pickups in NYC")

DATE_COLUMN = 'date/time'
DATA_URL = ('https://s3-us-west-2.amazonaws.com/'
         'streamlit-demo-data/uber-raw-data-sep14.csv.gz')

@st.cache
def load_data():
    data = pd.read_csv(DATA_URL, nrows=10000)
    lowercase = lambda x: str(x).lower()
    data.rename(lowercase, axis='columns', inplace=True)
    data[DATE_COLUMN] = pd.to_datetime(data[DATE_COLUMN])
    return data

data_load_state = st.text("Loading data...")
data = load_data()
data_load_state.text("Loaded!")

col1, col2 = st.columns(2, gap="large")

with col1:
    st.subheader("Number of pickups per hour")
    hist_values = np.histogram(
        data[DATE_COLUMN].dt.hour, bins=24, range=(0,24))[0]

    st.bar_chart(hist_values)

with col2:
    hour_to_filter = st.slider("hour", 0, 23, 17)
    st.subheader(f"Number of pickups at {hour_to_filter}:00")

    filtered_data = data[data[DATE_COLUMN].dt.hour == hour_to_filter]
    st.map(filtered_data)
Let’s now build the Anvil version of this app.
Step 1: Creating your Anvil app
We first need to create an Anvil app. Go to anvil.works/build and select Create new app. From the popup menu, choose New M3. Start with a Blank Panel Form.
Step 2: Building the UI
The first step in translating your Streamlit app into an Anvil app is to set up your UI. Looking at the running Streamlit app, we can see that we need a title for our app, a slider, two headers, a bar chart and a map.
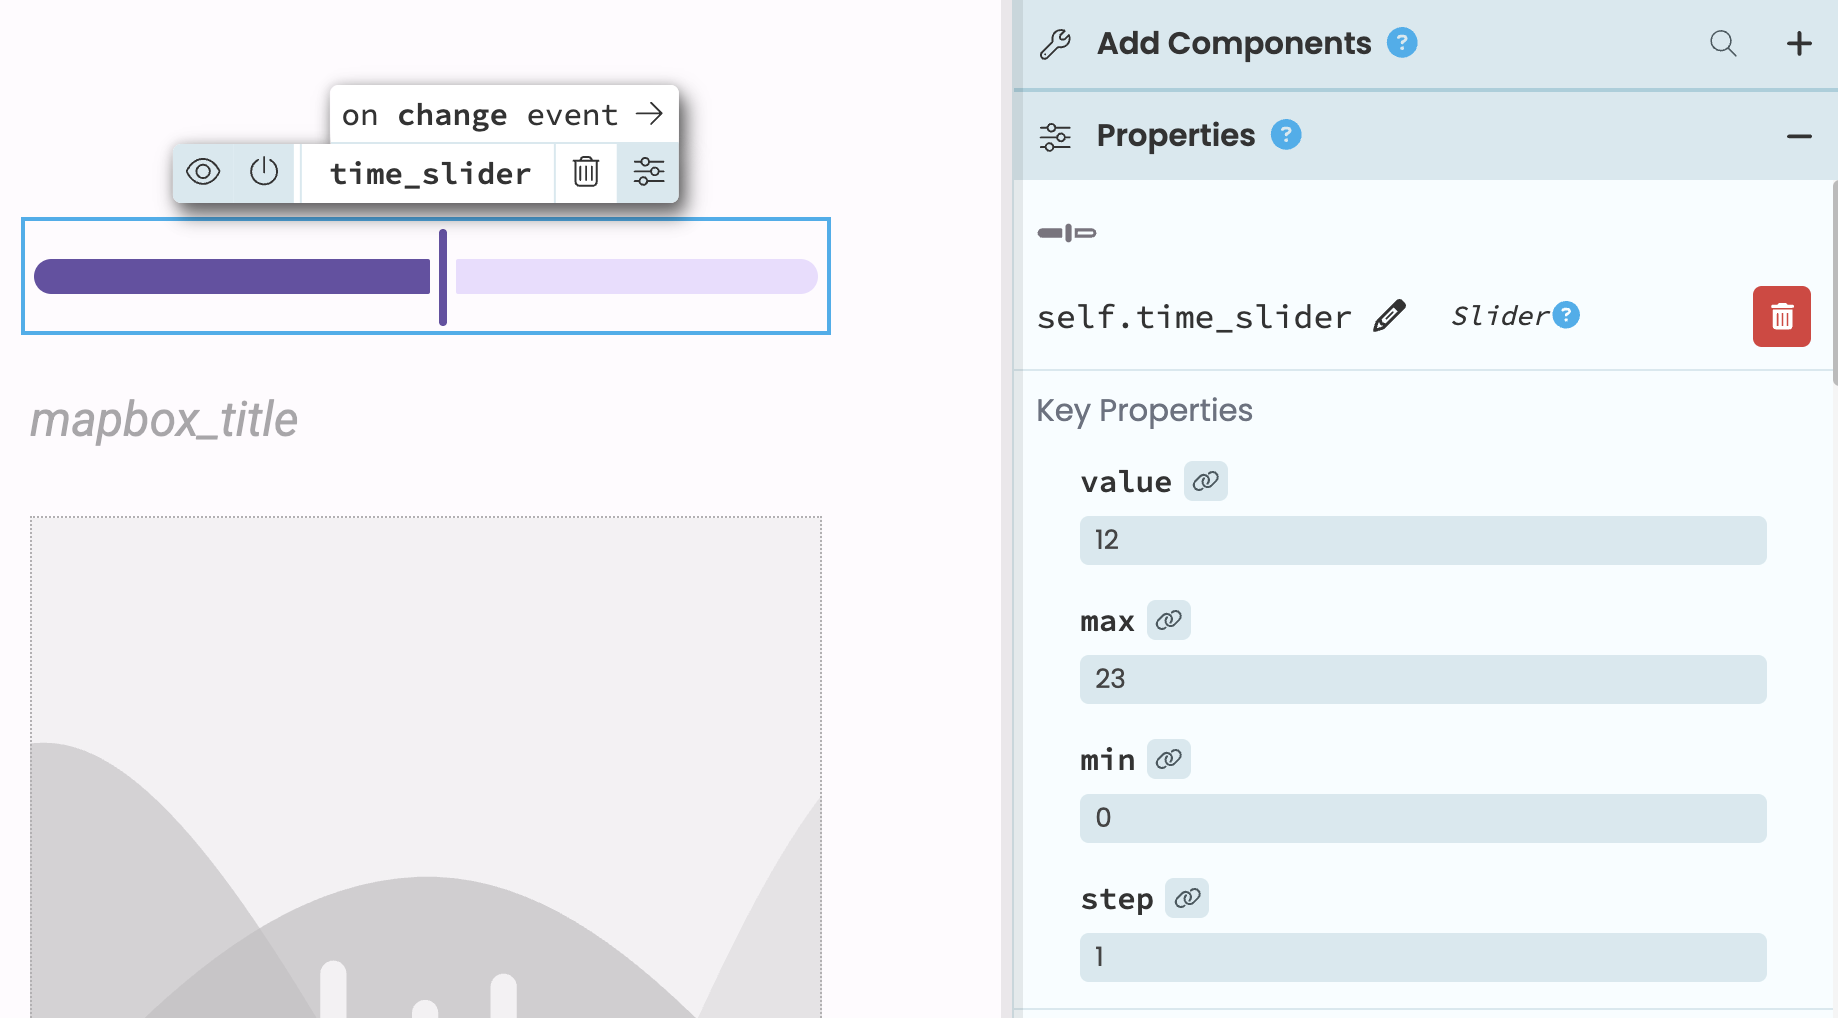
Drag the corresponding Anvil M3 components onto your Form: 3 Headings (for the title and headers), a Slider, and two Plots. A Plot component is a Plotly plot, and it has a data property that we can set to be a Plotly Graph Object.
We can see from this line of code: hour_to_filter = st.slider("hour", 0, 23, 17) that the Slider should range from 0 to 23 (to account for all the hours in a day) and its value should be initialized to 17. If you click on the Slider that you added to your Form, you can set its min, max and value from the Properties Panel on the right.
Step 3: Set up your Python environment
At the top of our Streamlit script, we’ve imported numpy and pandas. You can install packages in your Anvil app’s environment from the Python versions settings. In this case, we can just switch our app to use the Data Science base package as this will already have everything we need installed.
Step 4: Load your data
How you load your data into Anvil will depend on what kind of data you have. This example uses option one.
1. Large static file
This example app is using a static CSV file as its data source. (You can download this dataset here). You can store large, static files in your Anvil app using Data Files. Just click the blue plus button from the Sidebar Menu, add the Data Files service and upload your file.
2. SQL database
If your data is coming from an SQL database, you can use a database driver to connect a Server Module to your database. Learn more here: Anvil Docs | External Database
3. Dynamic CSV/Excel file
If you have data in a CSV or Excel file that you want to be able to update, delete or add to, you can import your data into a Data Table. Read this guide to learn how to use the Uplink to transfer your CSV or Excel data into a Data Table: Anvil Docs | CSV and Excel Import
Step 5: Write server functions
Because all Streamlit code runs on the server, we need to separate out which code will run on the client and which will run on the server in Anvil. Client code is any code that updates the UI in response to user interaction. Any code that does data processing, uses a Python package or deals with sensitive data needs to run on the server.
In our example, we need to load the data, create the histogram, and filter the map data on the server.
First, create a Server Module and add the necessary imports to the top of the Module. In this example, we need to import numpy, pandas and plotly.graph_objects (for the map data).
import pandas as pd
import numpy as np
import plotly.graph_objects as go
Then, write a function to load in the data and store it in a variable . Because we are using the Data Files service, it will look something like this:
def get_uber_data():
    #read in 10000 rows of data
    df = pd.read_csv(data_files['uber-raw-data-sep14.csv'], nrows=10000)
    df['Date/Time'] = pd.to_datetime(df['Date/Time'])
    return df

DATA = get_uber_data()
Now we can create a function that returns the histogram. We’ll want to call this function from the client code so we’ll need to add the @anvil.server.callable decorator:
@anvil.server.callable
def create_histogram():
    histogram = np.histogram(DATA['Date/Time'].dt.hour, bins=24)[0]
    return histogram
And a function that filters the data based on the hour and returns a Scatter Mapbox plot:
@anvil.server.callable
def get_map_data(hour=0):
    filtered_data = DATA[DATA['Date/Time'].dt.hour == hour]
    map_data = go.Scattermapbox(lat=filtered_data['Lat'], lon=filtered_data['Lon'], mode='markers')
    return map_data
Our final Server Module should look like this:
import anvil.files
from anvil.files import data_files
import anvil.tables as tables
import anvil.tables.query as q
from anvil.tables import app_tables
import anvil.server
import pandas as pd
import numpy as np
import plotly.graph_objects as go


def get_uber_data():
    #read in 10000 rows of data
    df = pd.read_csv(data_files['uber-raw-data-sep14.csv'], nrows=10000)
    df['Date/Time'] = pd.to_datetime(df['Date/Time'])
    return df

DATA = get_uber_data()

@anvil.server.callable
def create_histogram():
    histogram = np.histogram(DATA['Date/Time'].dt.hour, bins=24)[0]
    return histogram

@anvil.server.callable
def get_map_data(hour=0):
    filtered_data = DATA[DATA['Date/Time'].dt.hour == hour]
    map_data = go.Scattermapbox(lat=filtered_data['Lat'], lon=filtered_data['Lon'], mode='markers')
    return map_data
Step 6: Creating interactivity
The last step is to make our app interactive by connecting our server functions to our UI components.
The first plot we added should display the histogram as a bar chart using Plotly graph_objects. In your Form code, you should add this to the _init_:
self.bar_chart.data = go.Bar(y=anvil.server.call('create_histogram'))Next, we need to display our map data and update the map based on input from the Slider.
To do this, we first need to set up our map plot. Because we’re using a Mapbox map for this example, you’ll need a Mapbox API key, which you can get here. In the Form’s init, we can store the API key in a variable and initialize our plot’s layout.
    #create the map of pickup locations
    token = "<your-token-here>"
    #add the access token and center the map on NYC
    self.mapbox_map.layout.mapbox = dict(accesstoken=token, center=dict(lat=40.7128, lon=-74.0060), zoom=10)
    #remove padding from map
    self.mapbox_map.layout.margin = dict(t=0, b=0, l=0, r=0)
Now we just need our Slider to control what data appears on the map. From Design view, click on the Slider and scroll to the bottom of the Properties Panel to find all the events available for this component. Click on the arrow next to change_end to set up an event handler that will run when the user releases the Slider. In the function that was automatically created, we’ll get the current value of the slider, set the Header text and display the map data on our plot:
@handle("time_slider", "change_end")
def time_slider_change_end(self, **event_args):
    """This method is called when the Slider is no longer being dragged"""
    time = self.time_slider.value
    self.mapbox_title.text = f'Pickups at {int(time)}:00'
    self.mapbox_map.data = anvil.server.call('get_map_data', time)
Finally, add this line to the Form’s init function: time_slider_change_end(). This will run that function we just wrote and populate the map with the Slider’s default value.
Step 7: Publishing the app
If you want to publish your app to the web to share with others, click “Publish” at the top right. Here, you can give your app a public URL or switch to a private link. Go to the URL to visit your app that is already running live.
Your final app should look something like this:
Next Steps
Anvil has a lot of other features that can be used to expand your apps.
Here are just a few things that you can do:
- Build multi-user applications: Present users with a login form using one line of code and manage user accounts from within Anvil. Check out the tutorial and documentation.
- Store API keys and other sensitive information with App Secrets. Learn how here.
- Send and receive emails from your app. Learn more in our documentation.
Do you still have questions?
Our Community Forum is full of helpful information and Anvil experts.