Additional Debugging Tools in Anvil
In addition to the Interactive Debugger, Anvil has the Server Console and Running App Console, which can be useful for debugging both server-side and client-side logic, respectively.
Server Console
The Server Console is a python REPL (Read-Eval-Print Loop) that gives you direct access to a running Python process with all your application’s custom packages installed and ready to use. You can experiment with these packages, call Python functions written on the server, and test small code snippets.
Accessing Server Functions
To interact with the server module, you first need to import it:
import server_module_nameOnce imported, you can call this server module’s functions and test them independently.
import ServerModule1

ServerModule1.add_person_to_table(name="Love", workplace="Anvil")
This will add the person to the database, just as if the instruction came from the UI.
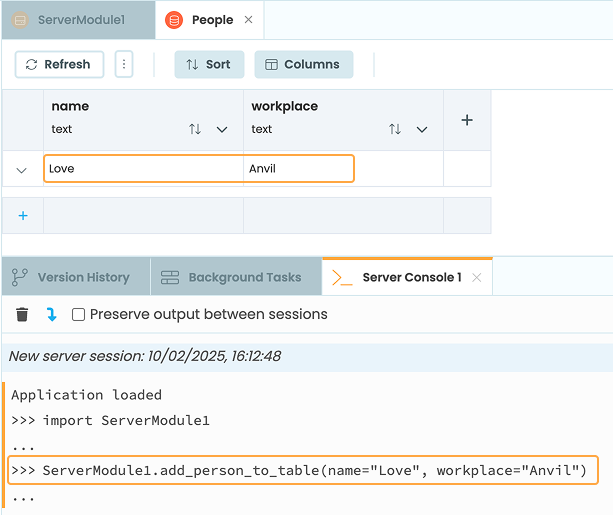
People table
This approach is useful for isolating and debugging server-side functionality separate from the UI flow, allowing you to verify your logic and identify issues quickly.
Interacting with Custom Python Packages
The Server Console also allows you to import and interact with third-party Python packages installed in your app. If you need to install additional Python packages in your app, check out Anvil Docs | Installing Custom Packages.
To use a custom package in the Server Console, simply import it:
import custom_package_nameFor example, if NumPy is installed in your app, you can use it directly in the Server Console:
import numpy

a = numpy.array([2, 4, 6])
print(a)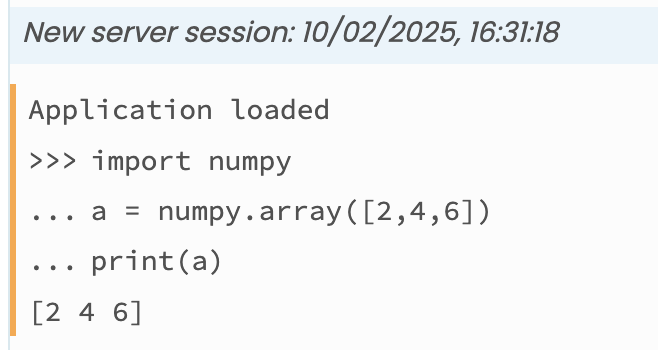
NumPy array output
With this, you can explore and test custom packages before fully integrating them into your application.
Running App Console
The Running App Console lets you interact with your application in real time through a REPL. Instead of stopping and rerunning the app to test changes, you can directly modify Form values, call server functions, and test behaviors while the app is running.
Accessing Components and Methods
To reference the current running Form, call:
#Get a reference to the open Form
get_open_form()
A good approach is to save this to a variable, so you can easily interact with your app’s components.
Calling Methods
From the App Console, you can call methods on the Form. For example, here is how you can refresh data bindings:
#Get a reference to the open Form
form = get_open_form()

#Call methods on the open Form
form.refresh_data_bindings()
In the same way, you can also call the methods in your Form from the App Console and use anvil.server.call(...) to invoke server-side functions.
Inspect and Update UI Properties from the Console
You can interract, inspect, and update the properties of UI components in your Form from the App Console. For example, you can check the items in a drop-down menu by running:
form = get_open_form()
form.refer_drop_down.items
This will print out all the options in the drop-down.
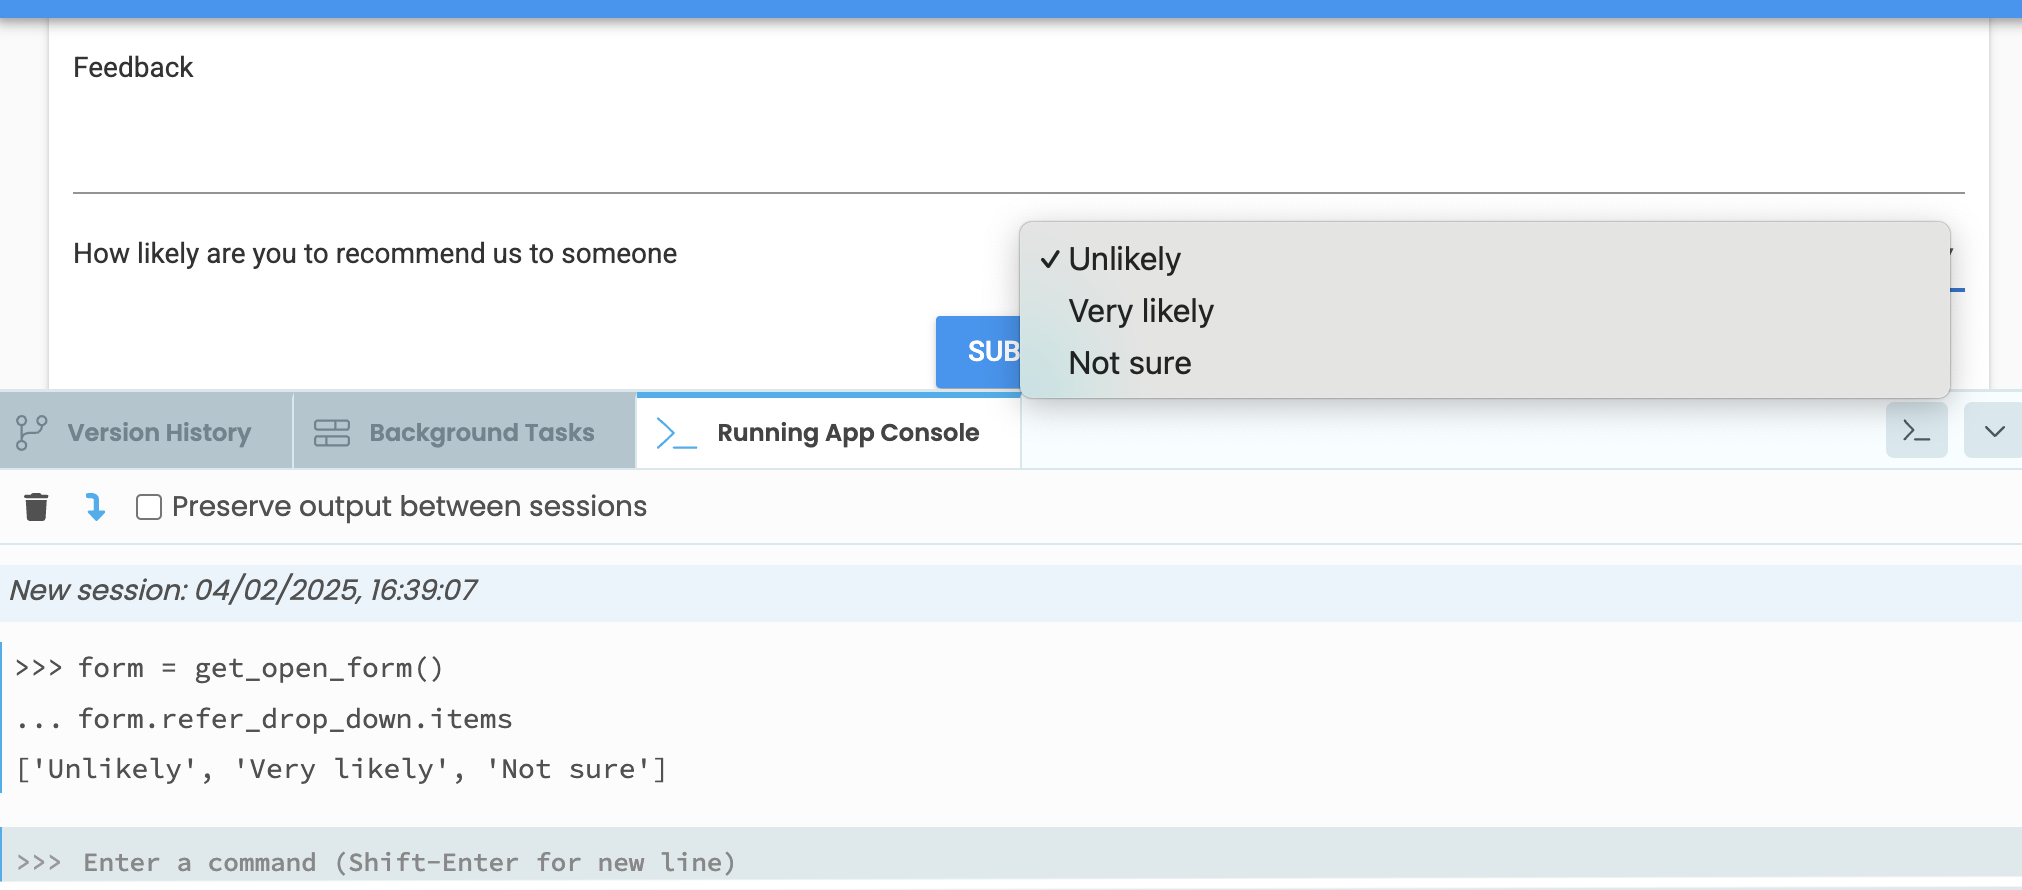
Drop-down items
You can also update the items in the drop-down:
#Update the items in the drop-down
form.refer_drop_down.items = ['No', 'Yes']
form.refer_drop_down.items
Which will update the running app:
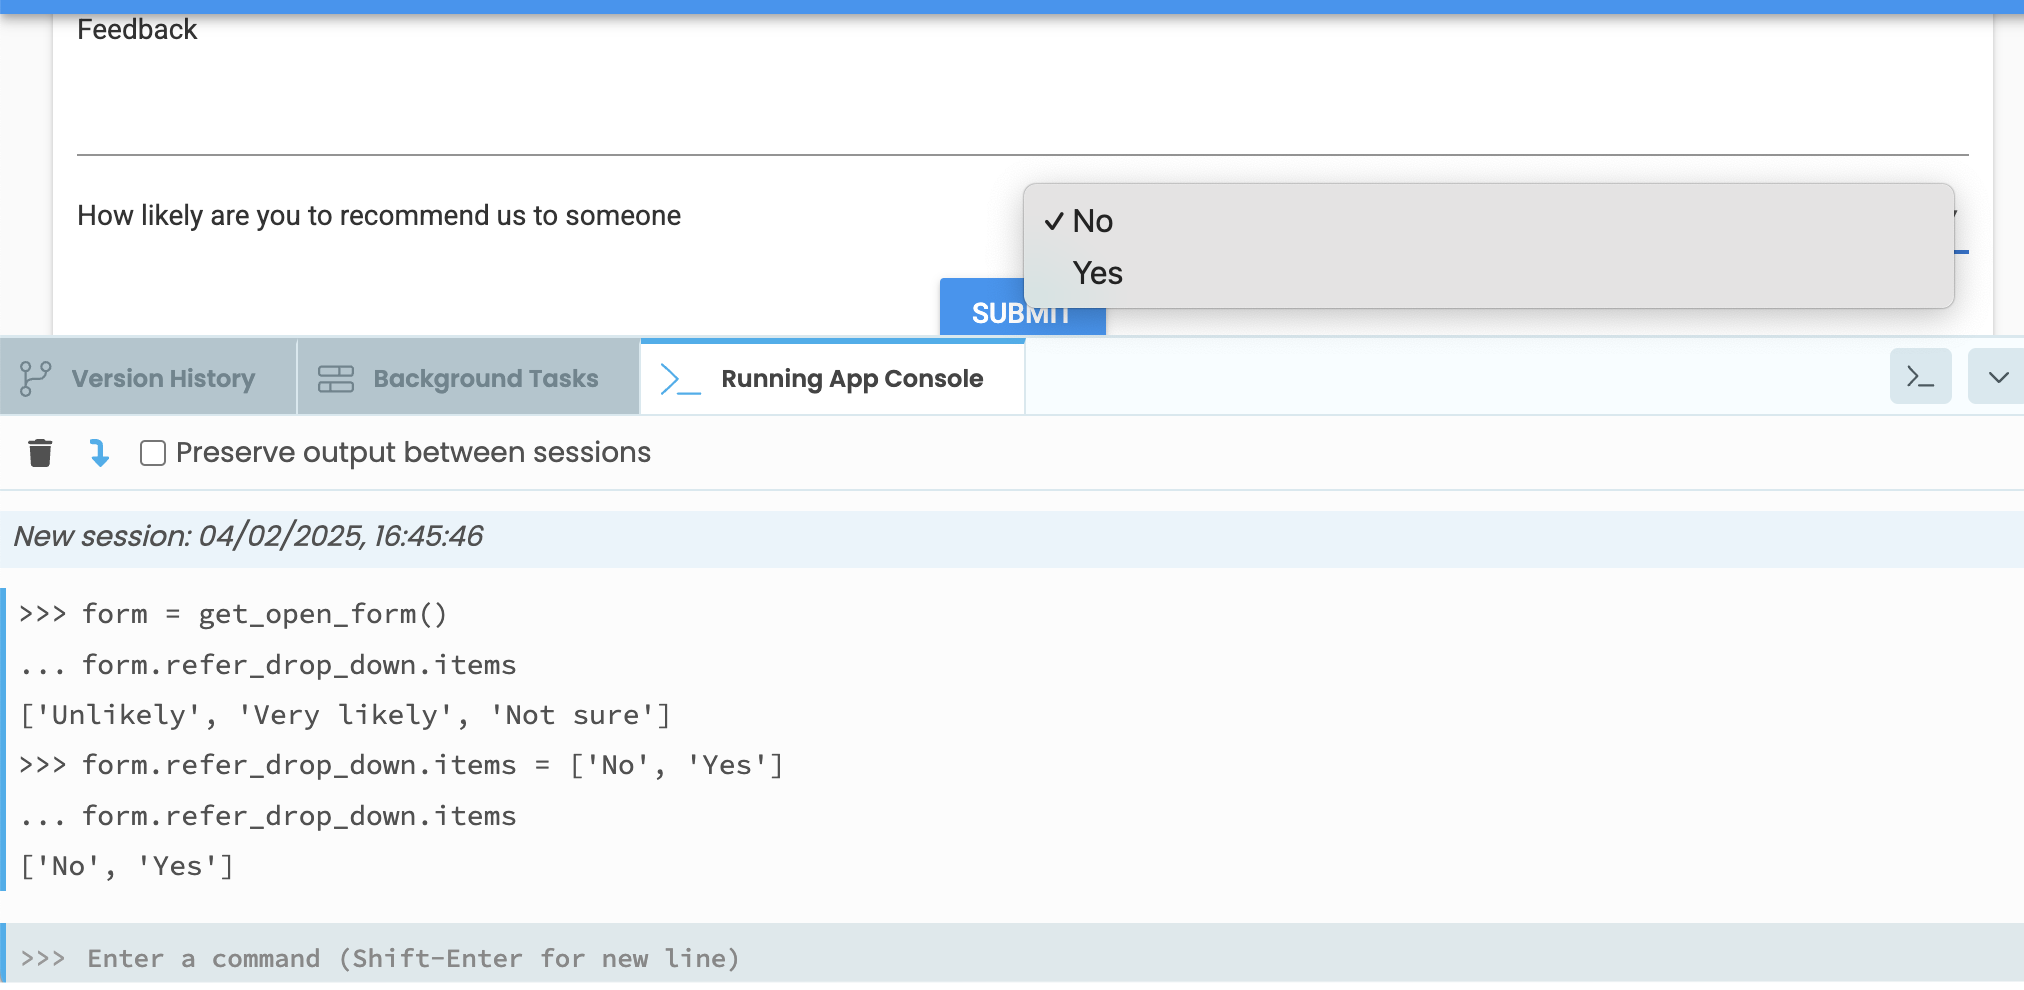
Updated drop-down items
Do you still have questions?
Our Community Forum is full of helpful information and Anvil experts.