Plotting fill patterns in plotly

Hello everyone,

Happy New Year!
I am a total Newbie (both to Anvil and to Plotly), still on my free account, running into an issue I can’t get my head around, despite lots of searching and trying to make sense of online sources. I need your help!

What I’m trying to do:
I am trying to use fillpatterns in plotly graphs in my client side code.

What I’ve tried and what’s not working:
In Jupyter Notebook, the following code

import math
import plotly.graph_objects as go

data = [(abs(round((math.sin(math.pi/30*x))*120,1))) for x in range(0,100)]
x = [x for x in range(0,100)]

fig = go.Figure()
fig.add_trace(go.Scatter(
      x=x, 
      y=data, 
      line=dict(width=3.0, color='red'),
      fillpattern=dict(fgcolor='red', fillmode='replace', shape="x"),
      stackgroup="one")
    )
fig.show()

produces a nice

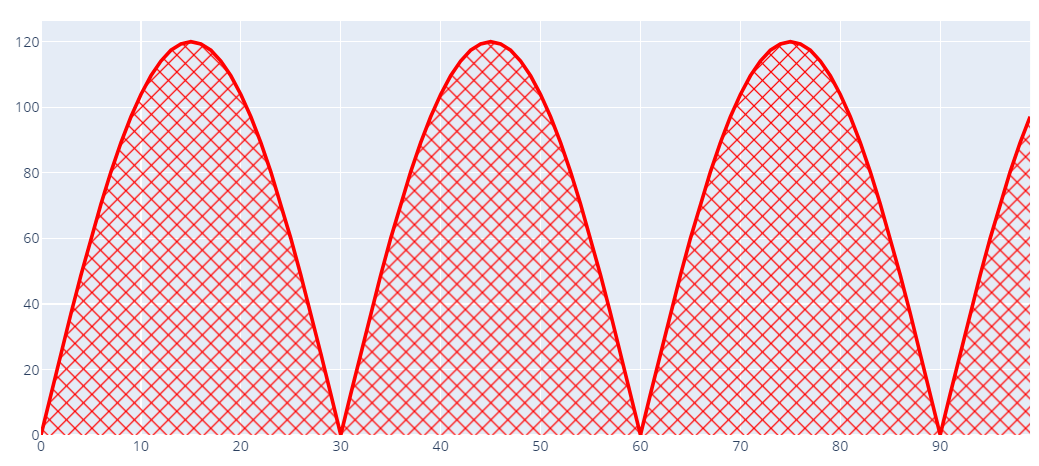
However, trying the same code inside my client side Anvil Form (with a Plot element self.plot_1) gives me a

TypeError: ‘WrappedObject’ object is not callable

error in the line with

fig.add_trace(go.Scatter(

modifying it to an Anvil style

from ._anvil_designer import Form1Template
from anvil import *
import math
import plotly.graph_objects as go

class Form1(Form1Template):
  def __init__(self, **properties):
    self.init_components(**properties)
    data = [(abs(round((math.sin(math.pi/30*x))*120,1))) for x in range(0,100)]
    x = [x for x in range(0,100)]
    plots = []
    plots.append(
      go.Scatter(
        x=x, 
        y=data, 
        line=dict(width=3.0, color='red'),
        fillpattern=dict(fgcolor='red', fillmode='replace', shape="x"),
        stackgroup="one"
      ))
    self.plot_1.data = plots

(where self.plot_1 is a Plot element dragged onto the form in the Anvil UI) I get

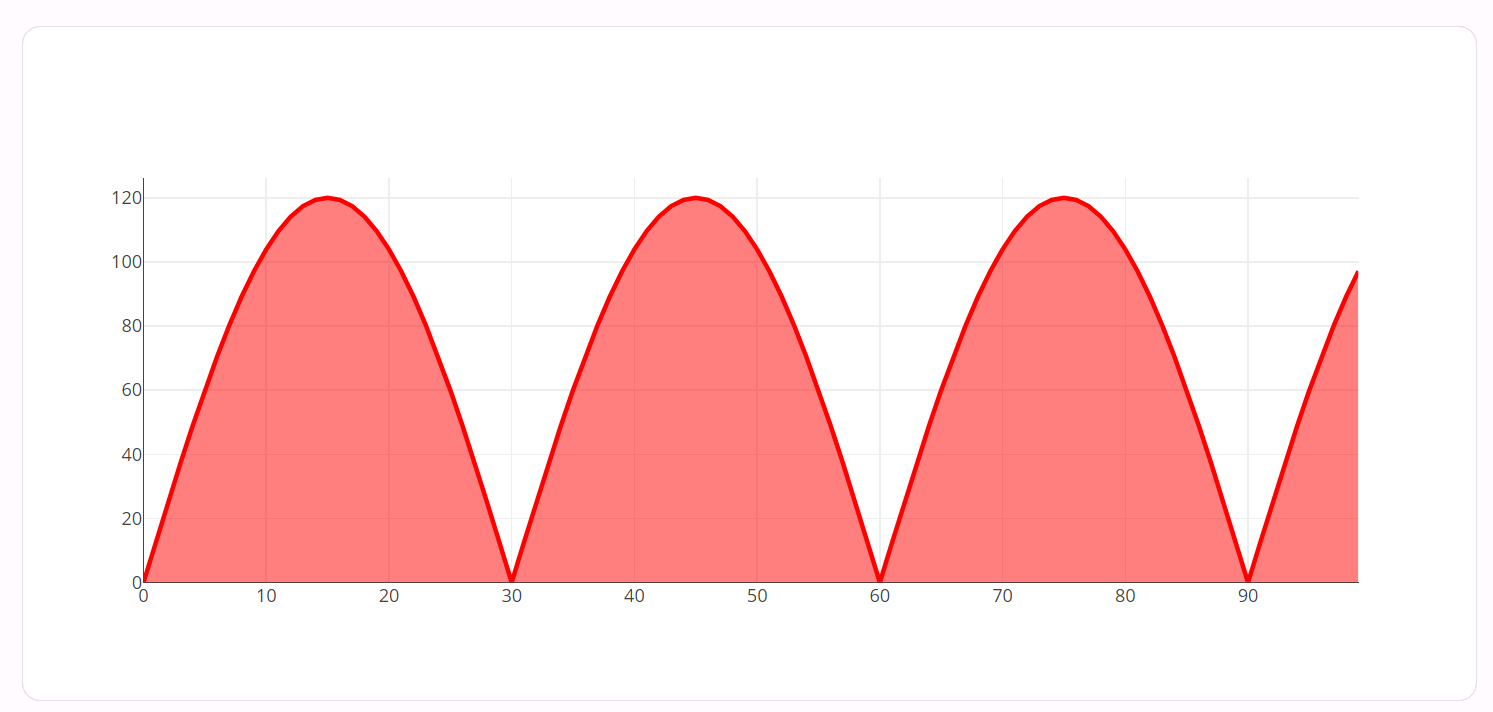
which is missing the patterns.

Is there a way to make these fillpatterns work in Anvil, ideally on the client side?

More generally:
Most Plotly examples e.g. for things like Sankey diagrams, use the

fig = go.Figure()

way of doing plotly. Is there a way to make this work with Anvil?

Thanks for any tips!

Tobi

I seem to remember the client side implementation has limitations. I’d try it with a server side and return the figure to your plot component or just hook up the uplink to your jupyter and return that demo plot to verify in the first instance.

@james.patrick , thanks!
That’s what I was trying to avoid as my experience so far has been that there is quite a performance hit for sending (lots of) data forth and back between client and server. But I can give it a try!

1 Like

@james.patrick , ugh, now even with server sided

import anvil.server
import math
import plotly
import plotly.graph_objects as go

@anvil.server.callable
def make_plot():
  data = [(abs(round((math.sin(math.pi/30*x))*120,1))) for x in range(0,100)]
  x = [x for x in range(0,100)]
  fig = go.Figure()
  fig.add_trace(go.Scatter(x=[1,2,4], y=[4,5,6],line=dict(width=3.0, color='red')))        
  fig.update_layout(height=600, width=800, title_text="My title")
  return fig

I get

TypeError: ‘WrappedObject’ object is not callable

for the line that has

fig.add_trace(…

Not sure what I’m doing wrong!

Tobi

If I get a chance tomorrow will have a tinker around, if nobody else has already come up with a solution by then of course!!

TLDR: fillpattern wasn’t added until plotly v5.7 and we use plotly v4.14

plotly.py/CHANGELOG.md at doc-prod · plotly/plotly.py · GitHub


More context:

Client:
Anvil’s client side plotly is based off of python plotly version 4.14.

Server:

  • Basic Python 3: equivalent to client side plotly in every way
  • Full Python 3: uses plotly v4.14.3
  • Python 3.10 (beta): uses plotly v5.11.0

I assume you’re using the Basic Python 3 on the server - hence the issue with add_trace not being callable.

If you use the Full Python 3 you’ll get an error since Plotly 4.14.3 doesn’t know about fillpattern.

If you use the Python 3.10 beta, you won’t get an error, but the client still needs to render the plot. And since the client version of Plotly is based on v4.14 it will just ignore the fillpattern argument.

Basically you’re stuck with rendering v4.14.3 features until we upgrade to plotly 5.

You might want to add some likes to this feature request:

@stucork , thank you for the quick and detailed answer!
I am still new to all this, so let me see if I understand it correctly:

  • I cannot use fillpattern because this feature is only implemented in a Plotly version not yet implemented. That part is easy.
  • I cannot use add_trace on the client side because it is not supported by the client side plotly version
  • I cannot use add_trace on the server side because I am using Basic Python 3.
    Once I use Full Python 3, I can use add_trace on the server side and then send the figure to the client - correct?
    Thank you very much for your help!
1 Like

Yeah. That sounds about right.

1 Like

Ok, I now am on the full Python 3 trial (got the email that it is now activated), and I am not getting the

TypeError: ‘WrappedObject’ object is not callable

error anymore (after switching the project to Full Python 3). Thanks!

1 Like