Curious if anyone can point to an example plotly plot using a background image stored as an asset. Lots of examples in Google but I’m finding that the methods/attributes in many examples are too confusing to translate to the Anvil model - pretty sure I’m just screwing up the constructs.
I can’t give you an example but Google plus the Anvil docs may be sufficient.
Google tells me that Plotly background images take a url pointing to the source.
I believe you can access Anvil assets via a url too. Please read the relevant docs here.
Have you tried connecting those concepts in Anvil to see if they work?
I’m trying this, but no luck.
class Form2(Form2Template):
  def __init__(self, **properties):
    # Set Form properties and Data Bindings.
    # BOTTOM GRAPH
    # We have to get the average Tb of the target from the two (to be three) months
    self.plot_2.layout(

    title='My title',

    images= [dict(
      source="https://myapp.anvil.app/_/theme/gcurve.png",
      xref= "x",
      yref= "y",
      x= 0,
      y= 10,
      sizex= 744,
      sizey= 1052,
      sizing= "stretch",
      opacity= 0.5,
      layer= "below")])
I’m getting this error:
After testing many things I determined that the client version of Plotly on Anvil doesn’t seem to support background images. I could very much be wrong here.
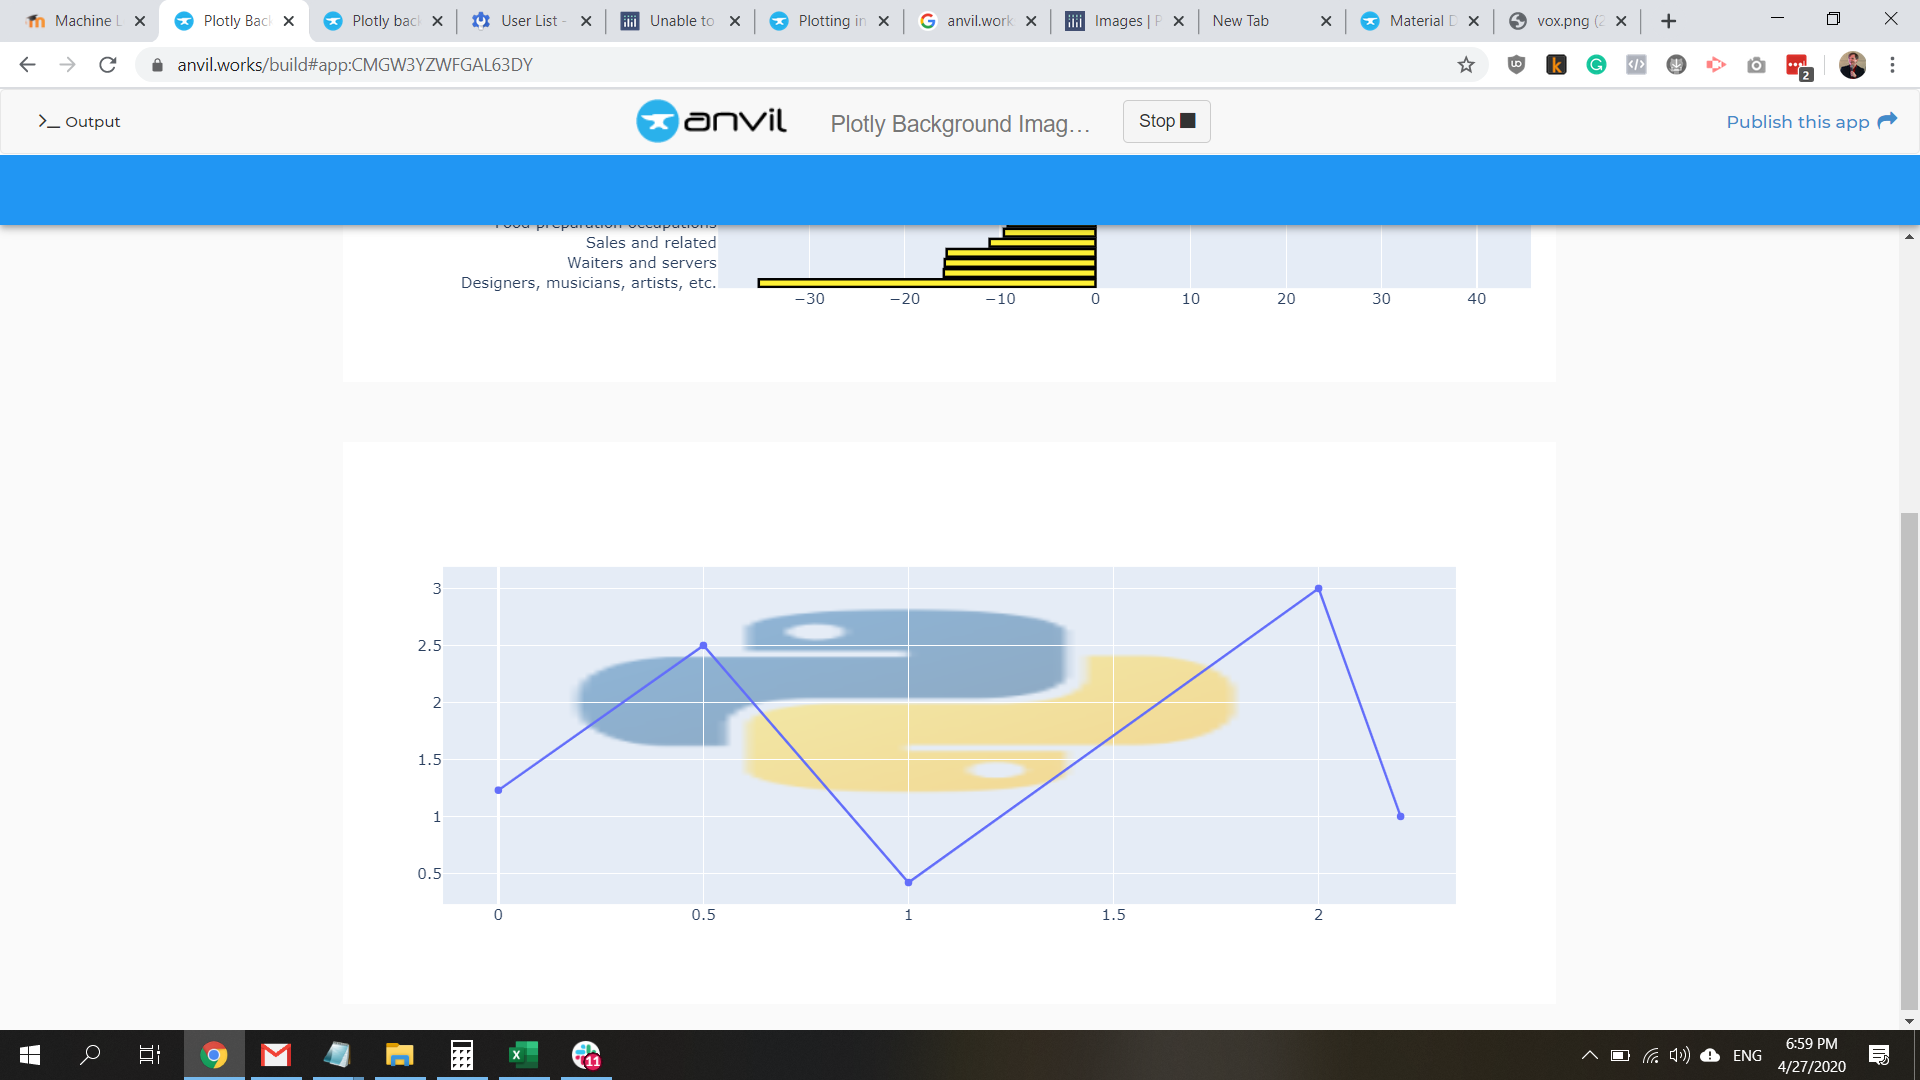
I was able to get background images working using the server-side library. However, you would need to be using the full Python environment. Here is a clone link:
https://anvil.works/build#clone:CMGW3YZWFGAL63DY=VV47YYU4IJ7KOW3T5BICFFTK
On the client side you simply call a server function:
self.plot_2.figure = anvil.server.call('make_plot_2')
Then on the server side you can write Plotly code however you feel like (either with the style you wrote or with the dictionary style that I copied from the Plotly docs for the top plot).
import anvil.server
import plotly.graph_objs as go

@anvil.server.callable
def make_plot_2():

  # Add trace
  data = go.Scatter(x=[0, 0.5, 1, 2, 2.2], y=[1.23, 2.5, 0.42, 3, 1])

  # Add images
  layout = go.Layout(images=[dict(
              source="https://images.plot.ly/language-icons/api-home/python-logo.png",
              xref="x",
              yref="y",
              x=0,
              y=3,
              sizex=2,
              sizey=2,
              sizing="stretch",
              opacity=0.5,
              layer="below")]
  )

  fig = go.Figure(data=data, layout=layout)
  return fig
Since you will probably need to grab the data from the server anyways, you could go ahead and build the full plot on the server and return the whole object to the client.
Just a note on that error you’re getting… it’s is because you are calling plot_2.layout(**kwargs)
but it’s not callable so instead do plot_2.layout = …or… plot_2.layout.update(**kwargs) I think might also work
on the client side the following works for me
import plotly.graph_objects as go

class Form1(Form1Template):

  def __init__(self, **properties):
    # Set Form properties and Data Bindings.
    self.init_components(**properties)
    data = go.Scatter(x=[0, 0.5, 1, 2, 2.2], y=[1.23, 2.5, 0.42, 3, 1])
    # Add images
    layout = go.Layout(images=[dict(
                source="https://images.plot.ly/language-icons/api-home/python-logo.png",
                xref="x",
                yref="y",
                x=0,
                y=3,
                sizex=2,
                sizey=2,
                sizing="stretch",
                opacity=0.5,
                layer="below")]
    )

    self.plot_1.data = data
    self.plot_1.layout = layout
Uggg I really thought I tried that and for some reason it didn’t work. ¯_(ツ)_/¯
Edit: Yep totally works. My server code always seems to work fine but my client code goes off the rails sometimes…
1 Like
The solutions above work for me when I use the example image, but for some reason not when I use my own images.
The only solution I’ve found that consistently works for me is this one:
Plotly unable to embed a logo or background image in plotly - #25 by Anthony1223 - Plotly R - Plotly Community Forum
source=encode_image_to_string(image_path)
import base64

def encode_image_to_string(image_path:str) -> str:
    with open(image_path, "rb") as image_file:
        encoded_string = base64.b64encode(image_file.read()).decode('utf-8')
        return f'data:image/png;base64,{encoded_string}'
I create the data and layout on the server, and the plotly figure on the client.