I’m trying to build a stacked bar chart with Plotly in Avil. The code is working on my local machine using Plotly. I’m using the method of creating figures and iteratively changing the figure to create the plot via go.Figure() which is described in the Plotly documentation here.
Here is the code (in a server module):
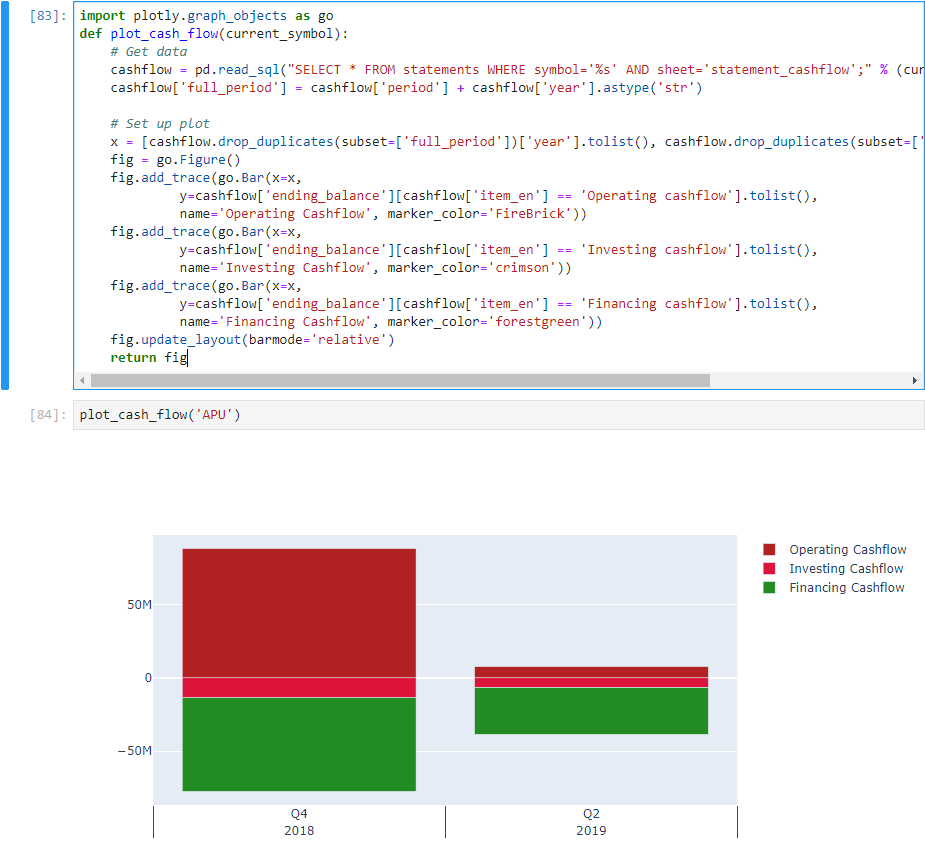
    @anvil.server.callable
    def plot_cash_flow(current_symbol):
      # Get data
      cashflow = pd.read_sql("SELECT * FROM statements WHERE symbol='%s' AND sheet='statement_cashflow';" % (current_symbol), conn)
      cashflow['full_period'] = cashflow['period'] + cashflow['year'].astype('str')

      # Set up plot
      x = [cashflow.drop_duplicates(subset=['full_period'])['year'].tolist(), cashflow.drop_duplicates(subset=['full_period'])['period'].tolist()]
      fig = go.Figure()
      fig.add_trace(go.Bar(x=x,
                 y=cashflow['ending_balance'][cashflow['item_en'] == 'Operating cashflow'].tolist(),
                 name='Operating Cashflow', marker_color='FireBrick'))
      fig.add_trace(go.Bar(x=x,
                 y=cashflow['ending_balance'][cashflow['item_en'] == 'Investing cashflow'].tolist(),
                 name='Investing Cashflow', marker_color='crimson'))
      fig.add_trace(go.Bar(x=x,
                 y=cashflow['ending_balance'][cashflow['item_en'] == 'Financing cashflow'].tolist(),
                 name='Financing Cashflow', marker_color='forestgreen'))
      fig.update_layout(barmode='relative')
      return fig
When running I receive the error AttributeError: module 'plotly.graph_objs' has no attribute 'Figure'.
On my local machine it appears to be working fine:
import anvil.server
from plotly import graph_objects as go

@anvil.server.callable
def plot_cash_flow(current_symbol):
  # Get data
  fig = go.Figure()
  return fig
and I get this error : ImportError: cannot import name 'graph_objects' from 'plotly' (/downlink/plotly/__init__.py)
Wonder if that has been implemented?
edit - I’m not much help with plotly itself I’m afraid, as I don’t use it.
In Plotly 4 they moved over to plotly.graph_objects. Prior to 4 plotly.graph_objs was used. In Anvil plotly.graph_objs is what is imported. Sorry for the confusion.
In 4 both are accessible but there was a syntax change to make it more pronounceable. So this makes it appear that Plotly 4 hasn’t been implemented by Anvil yet.
My original post was returning an entire figure (data + layout). In the Anvil documentation, it implies you should assign data to self.plot_name.data. Would it be possible to assign the entire figure to self.plot_name?
If this was possible it would be more in line with the Plotly style of figure creation and, in my opinion, make it easier to prototype and iterate plots.