Hi
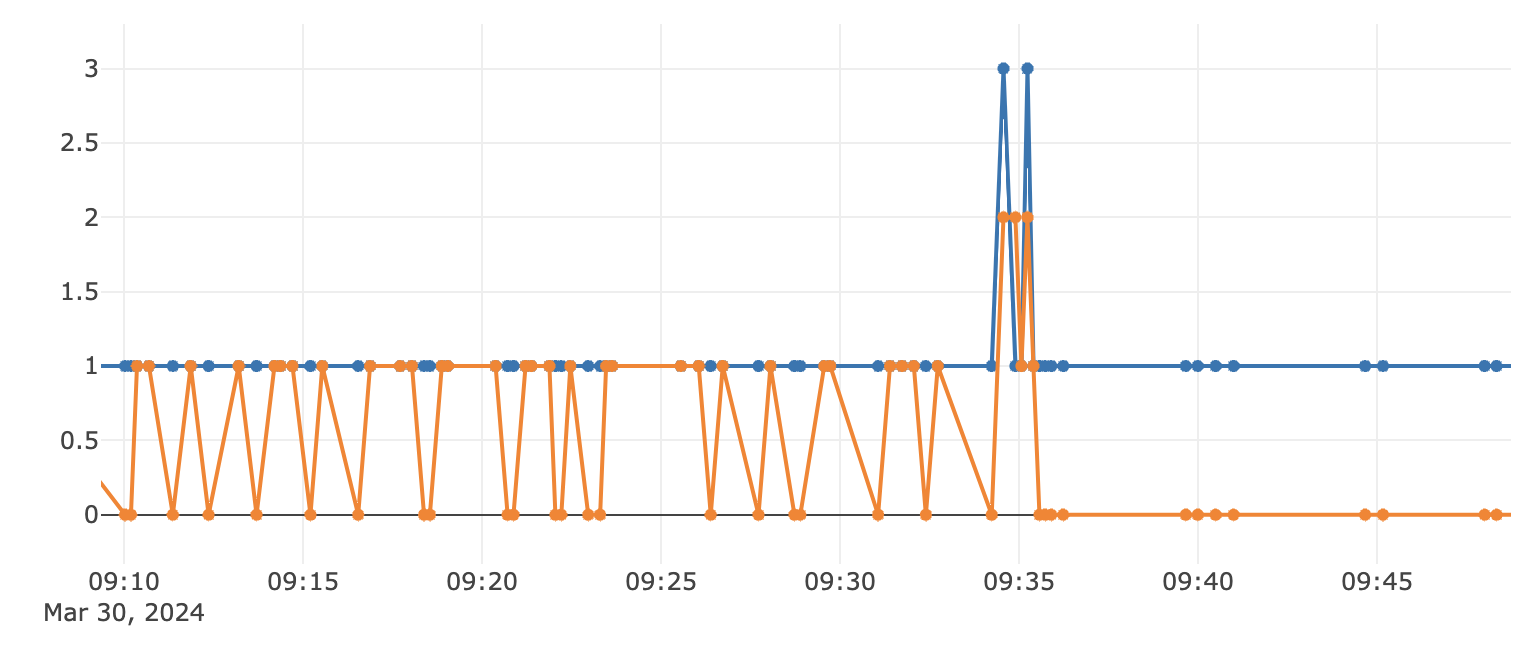
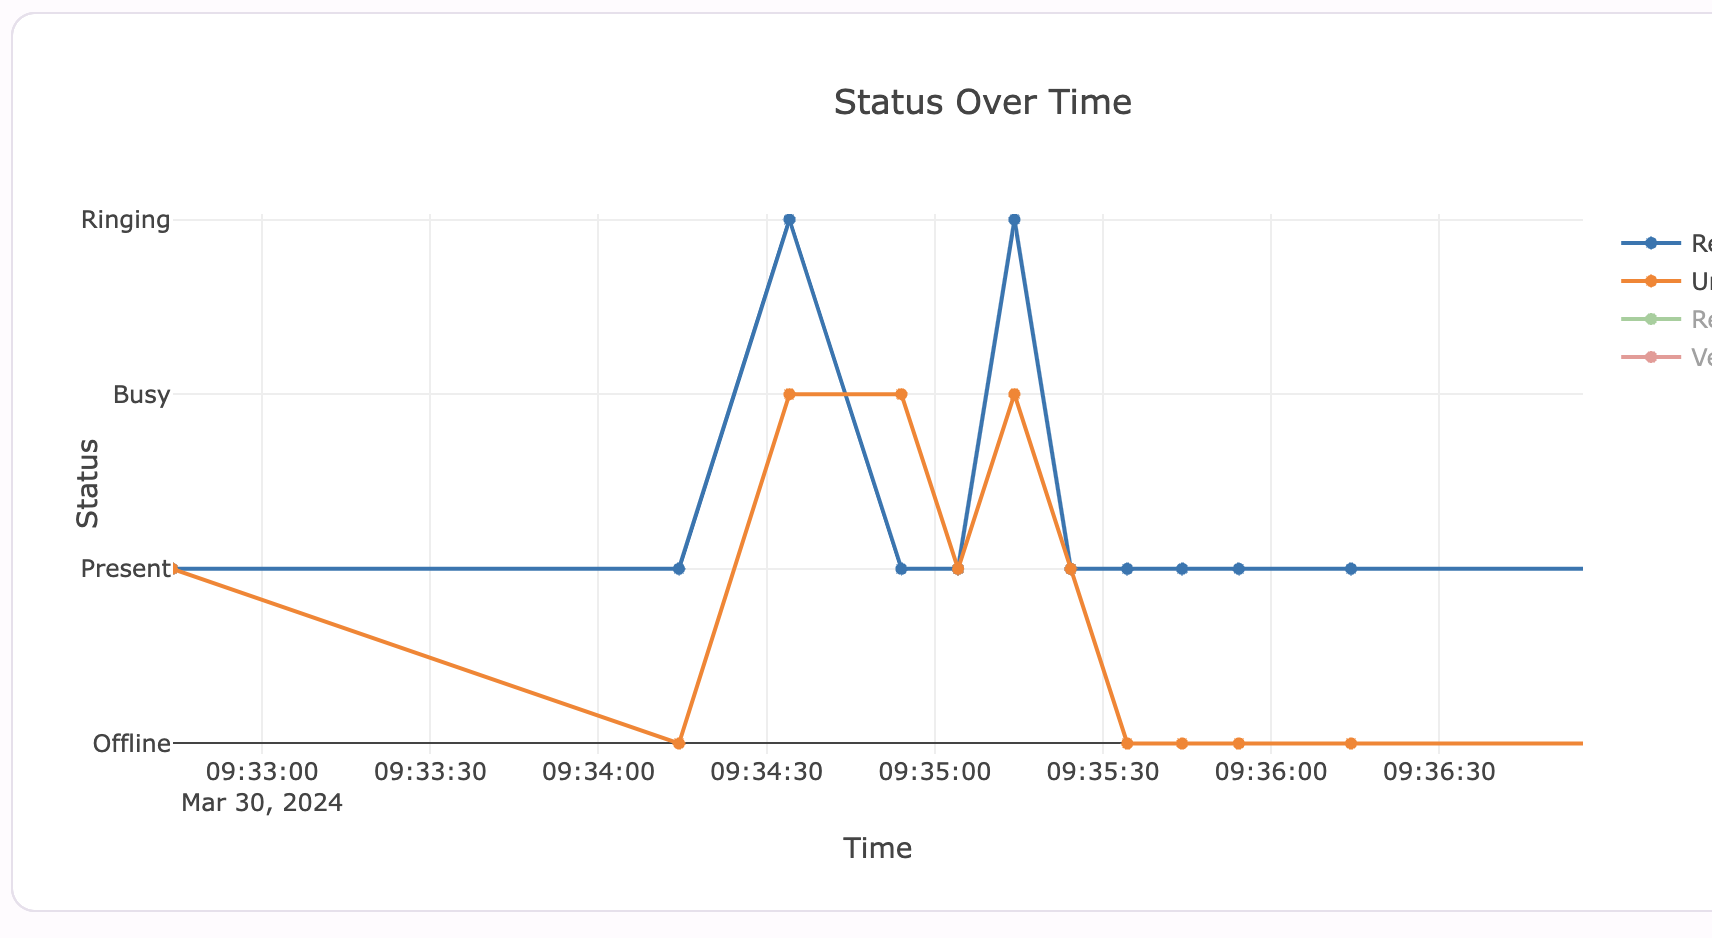
I have created the following plot. But i cannot figure out how to set a text for the y-axis values. Meaning, instead of displaying value 0 in the y-axis, i want it to display the text Offline; for the value 1, i want to display Present etc.
This is my form code:
from ._anvil_designer import Form1Template
from anvil import *
import plotly.graph_objects as go
import anvil.tables as tables
import anvil.tables.query as q
from anvil.tables import app_tables
import anvil.server
import datetime

class Form1(Form1Template):

    # Status mapping to numerical values for the y-axis
    status_mapping = {
        'Offline': 0,
        'Present': 1,
        'Busy': 2,
        'Ringing': 3
    }

    def __init__(self, **properties):
        # Set Form properties and Data Bindings.
        self.init_components(**properties)
        # Any code you write here will run before the form opens.

    def button_1_click(self, **event_args):
        app_tables.table_2.add_row(Column1=datetime.datetime.now())

    def button_1_copy_click(self, **event_args):
        # This button presumably fetches the data and updates the plot
        start_time = "03:00"
        end_time = "10:00"
        rows_between_dates = anvil.server.call('get_rows_between_dates', start_time, end_time)

        # Process the data into a plot-friendly format
        plot_data = self.process_data_for_plot(rows_between_dates)

        # Plot the data
        self.plot_status_data(plot_data)

    def process_data_for_plot(self, data):
        # This function transforms the data into a format that can be plotted
        plot_data = {}
        for record in data:
            timestamp = record['dt']
            for item in record['data']:
                if item['name'] not in plot_data:
                    plot_data[item['name']] = {'x': [], 'y': []}
                plot_data[item['name']]['x'].append(timestamp)
                # Use the mapping for statuses
                status_value = self.status_mapping.get(item['status'], -1)  # Default to -1 if status is not found
                plot_data[item['name']]['y'].append(status_value)
        return plot_data

    def plot_status_data(self, plot_data):
        # Clear any existing data
        self.plot_1.data = []

        for name, series in plot_data.items():
            trace = go.Scatter(
                x=series['x'],
                y=series['y'],
                mode='lines+markers',
                name=name
            )
            self.plot_1.data = self.plot_1.data + [trace]

        # Update the layout for the y-axis to display custom tick labels
        self.plot_1.layout.yaxis = {
            'tickvals': list(self.status_mapping.values()),
            'ticktext': list(self.status_mapping.keys())
        }

        # Update other layout properties
        self.plot_1.layout.title = 'Status Over Time'
        self.plot_1.layout.xaxis.title = 'Time'
        self.plot_1.layout.yaxis.title = 'Status'
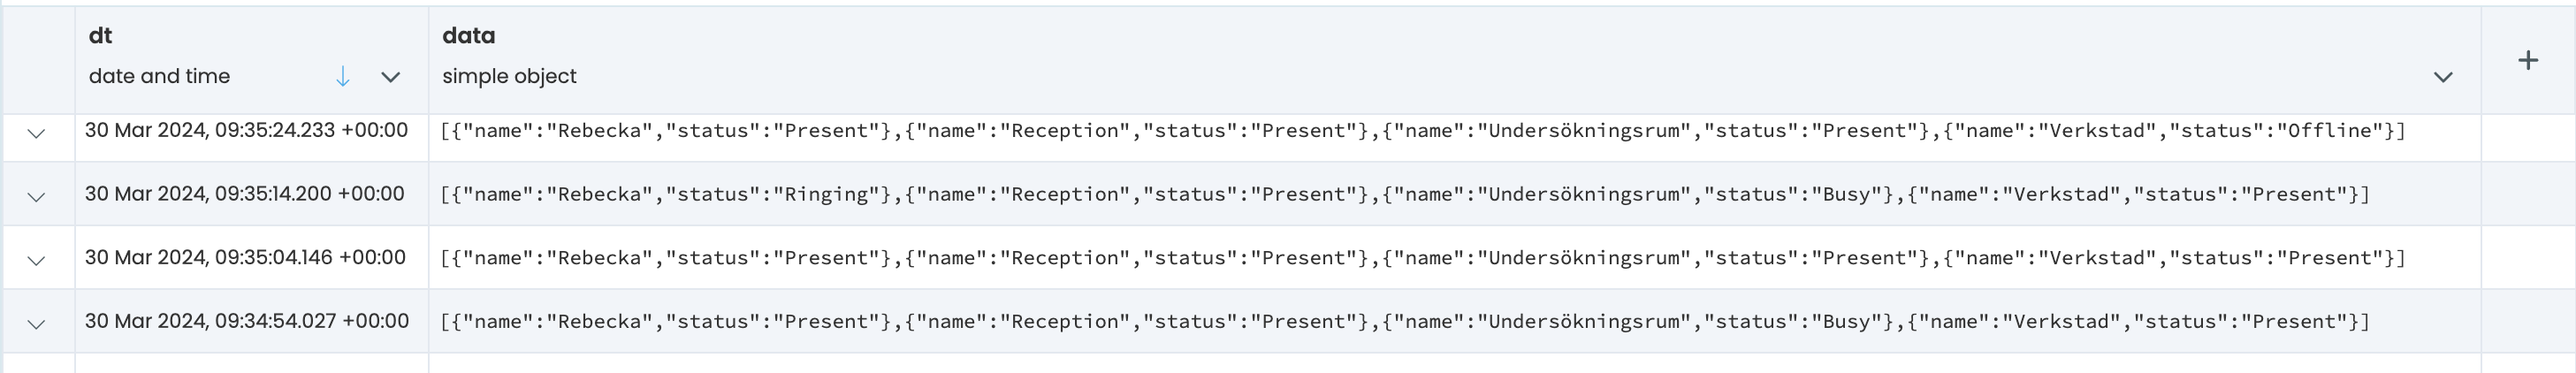
The data which i am displaying looks like this:
Any help is appreciated ![]()