What I’m trying to do:
I’m really excited about the new debugger
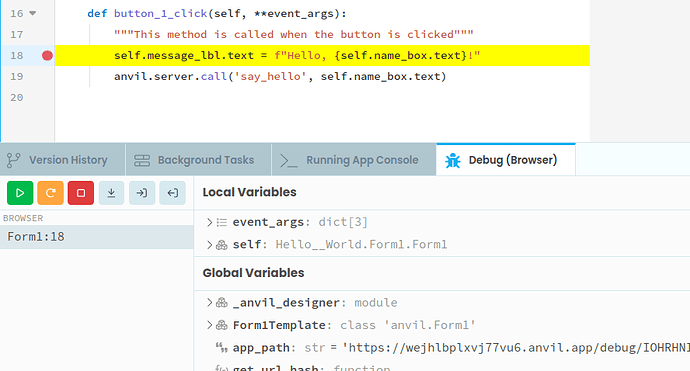
However when I run my code in the editor, with breakpoints enabled, I am not getting the Debug (Browser) window in this image:
image
What I’ve tried and what’s not working:
I’ve tried setting break points and running the debugger.
It will pop up in a newly created application.
Is there some toggle I’m missing?
1 Like
I’m not sure I follow.
Are you able to provide clone and breakpoint that you’ve set that isn’t working?
1 Like
I can send you an app id, if that helps? The issue is only occurring for pre-existing applications.
It the actual Debug (browser) tab in the bottom pane of the image provided that does not appear when I run the application.
Hi, did you try refreshing the Anvil editor or clearing your browser cache? Sometimes pre-existing apps might have cached settings that could cause this issue.
1 Like
Yes I have tried that.
Thank you for the suggestion!
