New: An interactive debugger in Anvil

Ever wanted to stop your code half-way through executing and see what’s going on?

Well, now you can. I’m pleased to announce that Anvil now has an interactive debugger!

Using the debugger

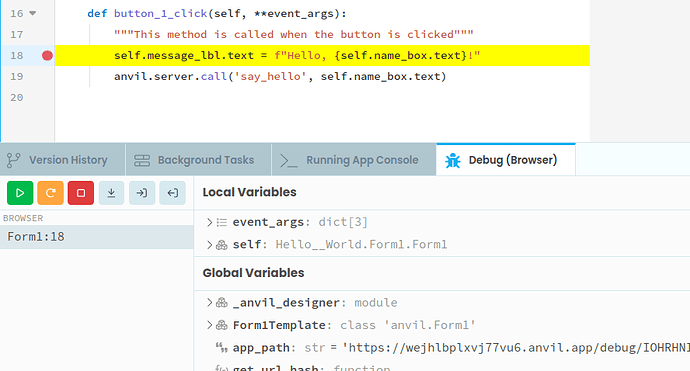
Just click the gutter next to your code to place a breakpoint:

image

When that line of code is about to run in the Anvil Editor, execution will pause and the debugger will open, showing you every variable in your code:

Going step-by-step

Use the buttons in the debugger to:

  • Resume (Continue executing indefinitely, or until the next breakpoint)
  • Step Over (Execute this line of code then pause again)
  • Step Into (if this line of code is a function call, pause inside the function, otherwise works like Step Over)
  • Step Out (execute to the end of the current function before pausing).

Tip: You can add and remove breakpoints while your code is paused! If you want to skip to the end of a block of code, place a new breakpoint at the end of that block and click Resume!

Debugging server code

Of course Anvil’s debugger works seamlessly across client and server code. Here’s a demo – watch me step from form code into server code, with access to the whole call stack:
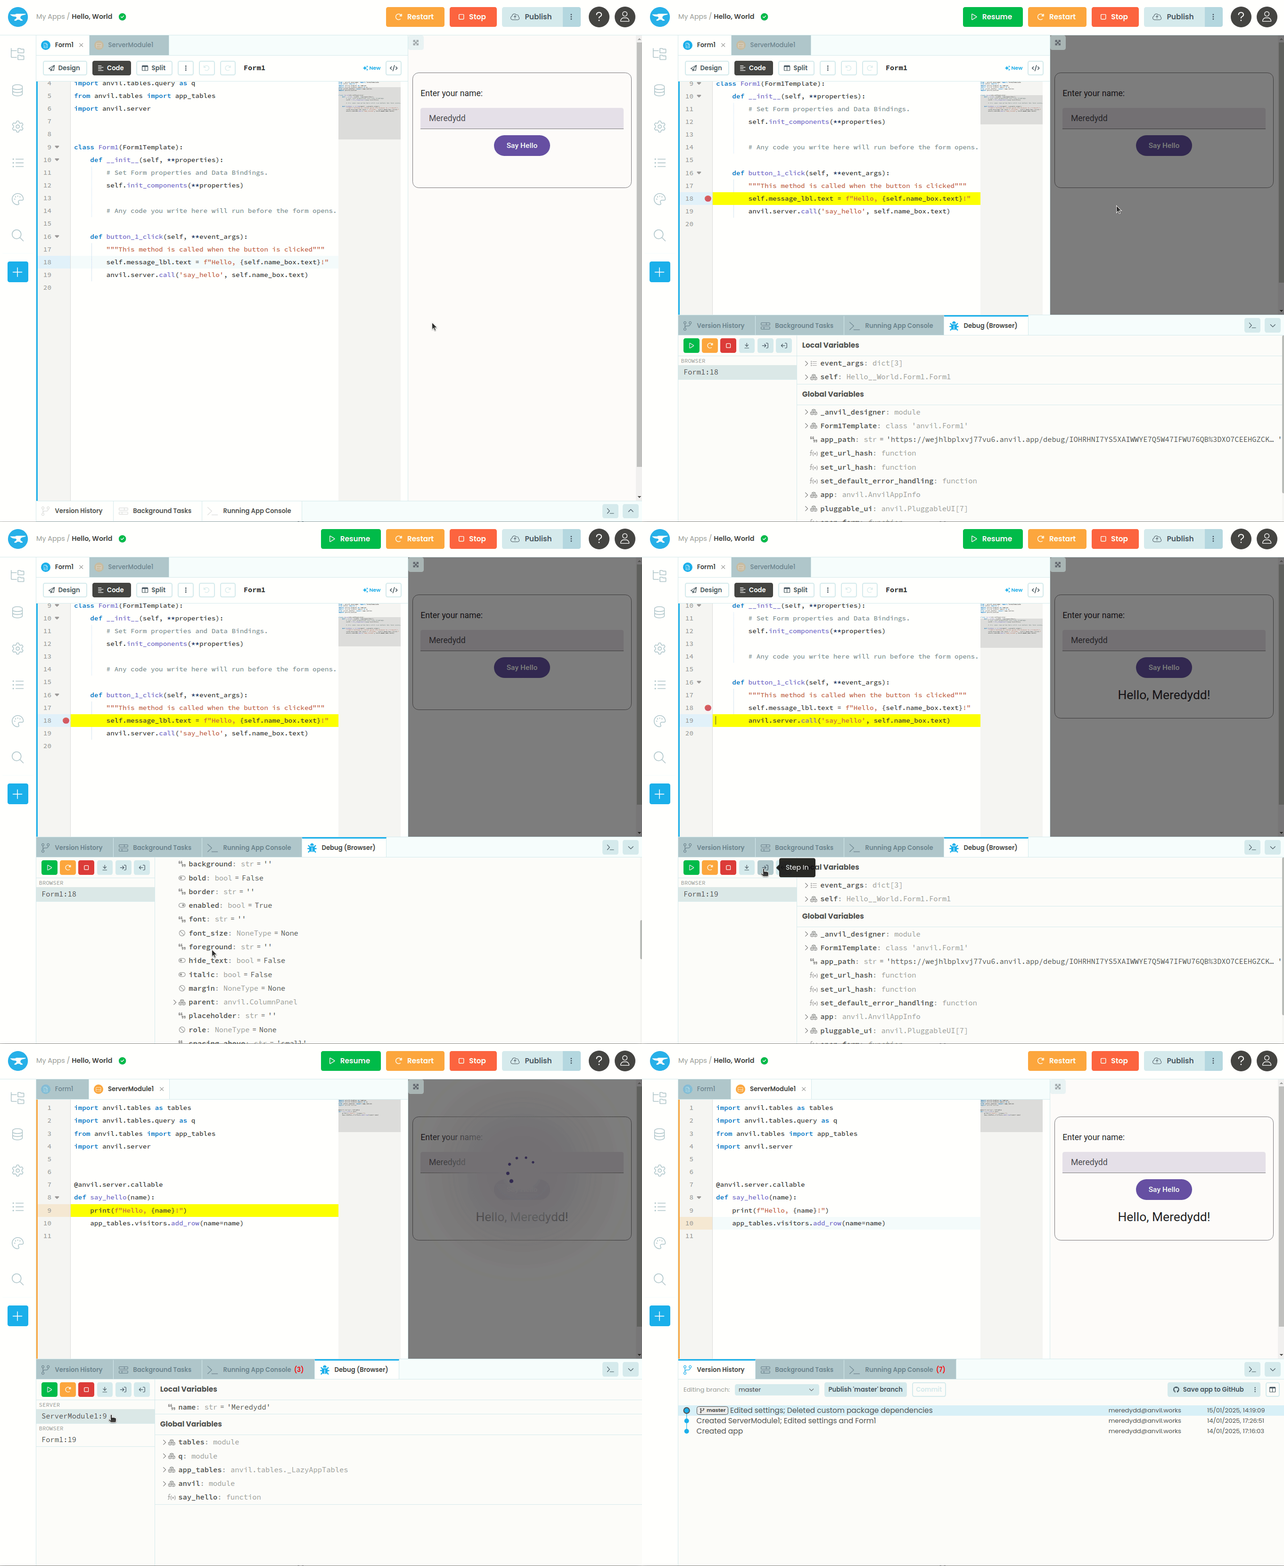
debugger-demo-2

What about background tasks and HTTP endpoints?

They work too! Just set a breakpoint at the appropriate point in your Server Modules, then launch that background task or hit that HTTP endpoint.

Note: The breakpoints you set only apply to your personal debug environment – that is, apps you run in the Editor or endpoints you call with a debug link. So if you want to use breakpoints to debug your HTTP endpoints, you’ll need to choose Get a link to my debug environment in the Publish dialog.

Availability

Everyone, including Free users, can use Anvil’s debugger on client-side (Form) code, but debugging server side code requires a Business Plan or higher.

Reporting issues

This is our first release of this new functionality, and naturally there will be corners that you folks will instantly battle-test in ways we never dreamed of :slight_smile:

If you’ve run into something that looks like a bug, or which you don’t know how to deal with, post in the Q&A forum as usual!

More coming soon

This is just the first version of the Anvil Debugger. We’ve got plans for lots more features - stay tuned!
29 Likes

That’s a great feature! Should make the debugging a lot simpler.

However, it does not seem to work when running in new tabs. Is that something that can be make possible?

Nice!

In the days when I was still on social media, one of my most popular tweets was:

One day, I shall learn to use a debugger other than print(“got here”) but it seems that today is not that day.

Perhaps today is…

7 Likes

Thanks @divyeshlakhotia - now fixed!

3 Likes

That’s exactly what I was thinking for myself as well!

1 Like

That’s great! This will make debugging some of those more complex interactions much nicer.

4 Likes

:exploding_head::partying_face:
Best Xmas present ever!

5 Likes

For those still on grandfathered Plans, I can say that my Professional Plan does not allow debugging server-side code. Still, I’m very happy to see breakpoints anywhere!

1 Like

Wonderful - thank, helps a lot :+1:

1 Like

WOW! Love this so much.

2 Likes

This is something I always dreamed of, even tried to create a debugger myself, but it was always something I thought it would never happen.

I think this is maybe the greatest addition ever! Thank you so much anvil staff!

4 Likes

When I first learned how to code in VBA and Matlab, I was using breakpoints all the time. It made being a beginner tolerable, especially with data processing scripts and more complex functions.

Over the years I just got used to using print statements but it is way less efficient than using breakpoints.

Thank you!

4 Likes

Nice!

And I second @owen.campbell’s post above :smiley:

3 Likes

Fantastic feature, long awaited for sure! @yahiakalabs exactly, it simplifies the learning experience for sure.

2 Likes

Absolutely! You might never have heard of unit testing, but you can still single-step through brand-new code, and see for yourself where it is going wrong.

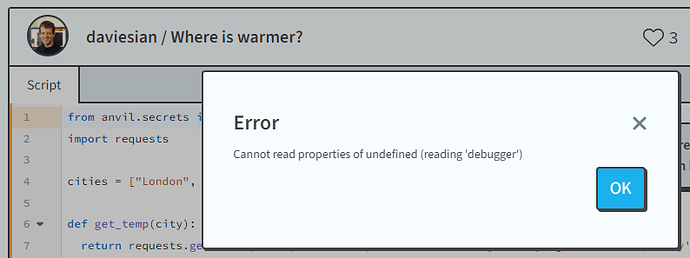
Edit: As a learning tool, the obvious place to add this is in py.space. It’s almost there:

One question about this: most of the time I reuse functions that are in a single dependency that I made for this exact purpose. The dependency purpose is to only serve as a dependency. It will not be possible to debug it’s code inside another app that depend of it, right? Just to be sure.

1 Like

This is so me. I know there is the logging library, and that I should probably learn to use a debugger, but I never found a tutorial that would help me to learn it.

:slight_smile: Glad not to be the only one