I found a line in the app log talking about import time and 6 server calls.
What is this about?
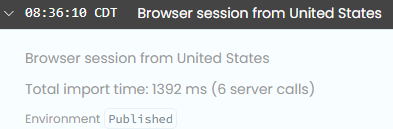
I found a line in the app log talking about import time and 6 server calls.
What is this about?
Unless you have persistence server enabled, Anvil spins up a new environment for every server call. It’s basically telling that your app took a total of 1392 ms in import time because of this. This should increase on every server call.
I do have persistent server enabled. Perhaps that was just an occasional restart.
I would still like to know what the 6 server calls were for. I don’t like to be told you did something wrong, but I’m not telling you.
Knowing what triggered each one of those calls would be of great help. See Add logging of all round trips
Just confirming, did you really had only 6 server calls or more than that?
I remember the docs saying that it doesn’t always stay persistent (probably due to crashes)
In my apps I always try to have only one server call for the data I need.
Here there may be more round trips for the user service or for other unknown reasons. I would love to see them all listed in the logger, so I know what I need to work on.
The server can restart after crashes, updates, etc., and an app can restart after changes to the app, to any of its dependencies, etc.
(A) A bunch of this is already visible in your session’s tracing.
(B) Very, very much watch this space 

Thank you, I remember reading about Profile and Traces, but I had never used it and forgot about it.
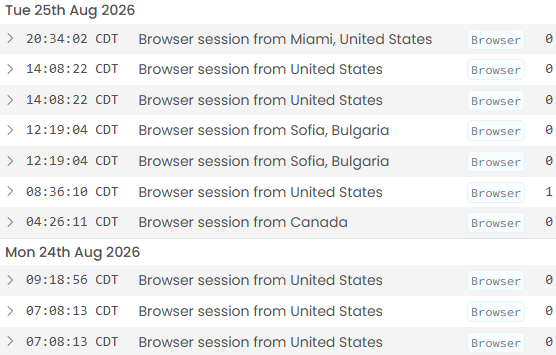
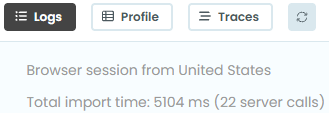
I just checked that app log again, and noticed that most sessions have 0 log entries as expected, because I have persistent server enabled. Once in a while there is a session with 1 log entry. Today that session shows more than 5 seconds to execute 22 server calls:
The profiler shows nothing:
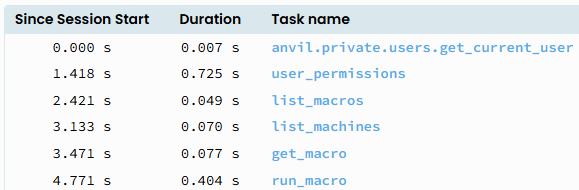
Traces are there:
I do see 5-ish seconds from user authentication to final macro run, but if I add up those times I get 1.3, not 5 seconds, and those are 6 operations, not 22. So there is more than I can see going on.
Yay profiling!
I have an AI skill that injects or removes profiler.start/profiler.stop to entry/exit points of the functions I want to profile.
I use this with my own Profiler class to find bottle necks, both in Python and in VBA. It’s something like: add profiler entry/exit point logging to the main functions, run a test, analyze the profiler output, add more entry/exit to the slow part, keep iterating until you find the bottleneck.
This allowed me to find the weridests wastes of time in COM, VBA, garbage collection… In VBA this usually results in “do not use this resource because Windows is unpredictable”.