Trying to fix Code for an app to plot list A vs B inputs

i am a student looking to build an app that allow users to input the values for List A and B through the app interface and display the plot of A vs B on the interface using plotly or matplotlib ( my 2nd year project)

i have been trying this an it is not working out.
can you put me through this or write the code for me
need urgent assistance, thanks

Please show us what you have tried, so we can help help you and tell you what you did wrong.

And please, do not use the word ā€œurgentā€ on the subject. You don’t pay us enough for us to stop what we are doing and start helping you. :slight_smile:

Here is a guide on how to ask good questions, so you increase the chances of getting helpful answers: How to ask a good question

Thanks for quick response
here is the link for the app
when the plot button is clicked, it should display a chart of the plot on the interface, but i am confused on how to do this

OH!, I’m sorry about the urgent i used. My bad

Please read the post about how to ask question.
The link you are shared is not helpful.

1 Like

Here is the full details: I don’t really know much of python, just start learning so i was using AI to write some codes ( Blackbox AI):

the interface in the app HTML and CSS was from blackbox as well as the server module.

import {Plotly} from '@anvil/plotly';

export const handleSubmit = async () => {
    const listA = document.getElementById('listA').value;
    const listB = document.getElementById('listB').value;

    // Convert lists to numerical arrays
    const arrayA = JSON.parse(`[${listA}]`);
    const arrayB = JSON.parse(`[${listB}]`);

    // Create figure with subplot
    const fig = {
        data: [
            {
                x: arrayA,
                y: arrayB,
                mode: 'lines',
                name: 'A vs B'
            }
        ],
        layout: {
            title: 'A vs B',
            xaxis: {
                title: 'List A'
            },
            yaxis: {
                title: 'List B'
            }
        }
    };

    // Render plot
    const plotComponent = new Plotly.PlotComponent();
    plotComponent.layout(fig.layout);
    plotComponent.plot(fig.data);

    // Add plotComponent to your desired UI container
    document.getElementById('your_container_id').appendChild(plotComponent.element);

    // Add interactive widgets
    plotComponent.layout({
        updatemenus: [
            {
                buttons: [
                    {
                        label: 'Toggle A',
                        method: 'toggleA'
                    },
                    {
                        label: 'Toggle B',
                        method: 'toggleB'
                    }
                ]
            }
        ]
    });

    function toggleA() {
        const visibility = Array.isArray(arrayA) ? arrayA.map((val) => val !== 0).toString() : '';
        plotComponent.updateTracesVisibility(visibility, 'A');
    }

    function toggleB() {
        const visibility = Array.isArray(arrayB) ? arrayB.map((val) => val !== 0).toString() : '';
        plotComponent.updateTracesVisibility(visibility, 'B');
    }
};
...

Html:

<!DOCTYPE html>
<html lang="en">
<head>
    <meta charset="UTF-8">
    <meta name="viewport" content="width=device-width, initial-scale=1.0">
    <title>A vs B</title>
    <link rel="stylesheet" href="style.css">
</head>
<body>
    <form @submit.prevent="handleSubmit">
        List A:
        <input type="text" v-model="listA" />
        List B:
        <input type="text" v-model="listB" />
        <button type="submit">Plot</button>
    </form>
    <div v-if="plot"></div>
</body>
</html>

The CSS for the html

body {
    font-family: Arial, sans-serif;
}

form {
    margin: 0 auto;
    max-width: 500px;
    padding: 20px;
    border: 1px solid #ccc;
    box-shadow: 0 0 10px rgba(0, 0, 0, 0.1);
}

form input[type="text"] {
    width: 100%;
    padding: 10px;
    font-size: 16px;
    border: 1px solid #ccc;
}

form button[type="submit"] {
    background-color: #4CAF50;
    color: white;
    padding: 10px 20px;
    border: none;
    border-radius: 5px;
    cursor: pointer;
}

form button[type="submit"]:hover {
    background-color: #3e8e41;
}

div.plotly-chart {
    height: 500px;
    width: 100%;
}

that is all the codes i have in the app.

It looks like you are trying to use javascript, css and html, which defeats the purpose of using Anvil, where everything is easier and you can do all in Python.

You should start working on a tutorial, so you can see how Anvil works.

I’m not familiar with the tutorials, but I’m guessing the dashboard tutorials in this page should be helpful for you.

2 Likes

Thanks for your support
i have used the anvil drag and drop for the interface and define the client sever code and server module all in python.

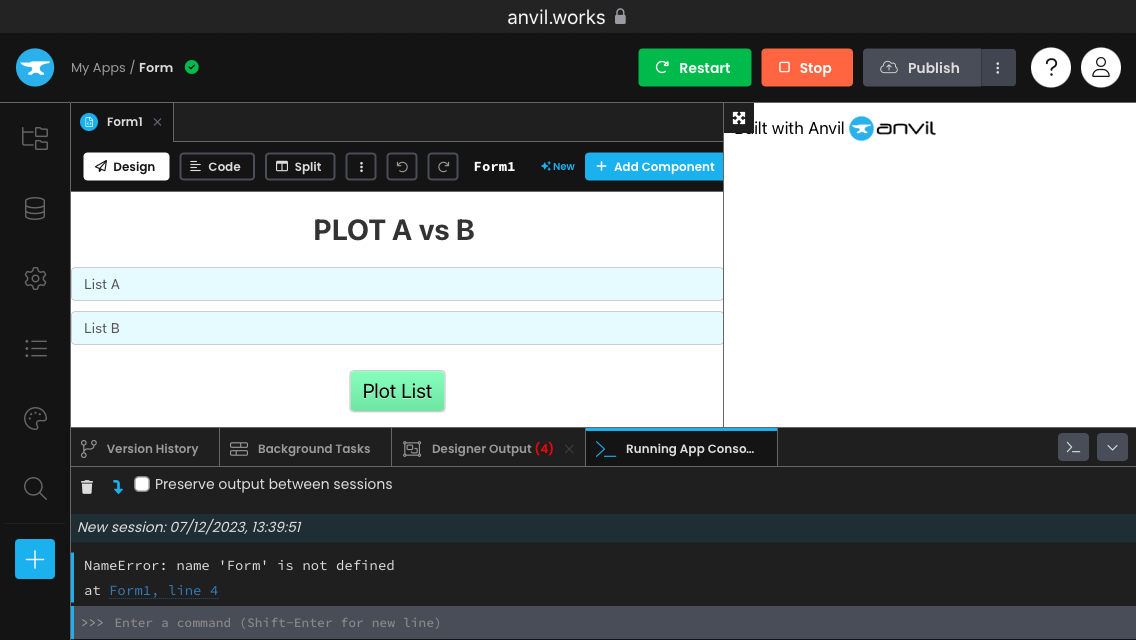
but i’m encountering an error while running the app:

here is the client server code:

from anvil import *
import anvil.server

class Form1(Form):  # Ensure that your main form is named Form1
    def __init__(self, **properties):
        self.init_components(**properties)
        self.plot_1 = Plot(component_type="div", show_marker=True)
        self.add_component(self.plot_1, slot="plot", visible=False)

    def button_plot_click(self, **event_args):
        list_a = [float(val.strip()) for val in self.text_box_a.text.split(",")]
        list_b = [float(val.strip()) for val in self.text_box_b.text.split(",")]

        self.call_server("generate_plot", list_a, list_b)

    def display_plot(self, plot):
        self.plot_1.visible = True
        self.plot_1.plot(plot)

    def text_box_a_change(self, **event_args):
        self.plot_1.visible = False

    def text_box_b_change(self, **event_args):
        self.plot_1.visible = False

Here is the code for the server module:

import plotly.graph_objs as go

# Server function to generate the plot
@anvil.server.callable
def generate_plot(list_a, list_b):
    # Generate the plot using Plotly
    plot = go.Figure(data=go.Scatter(x=list_a, y=list_b, mode='markers'))
    return plot.to_html(full_html=False)

Here is the code
thanks for your support

What error?
At what line?
When you do what?

Okay. When I try running the app, it shows

NameError: name ā€˜Form’ is not defined
at Form1, line 4

This line is wrong. Form1 should derive from Form1Template (or something similar).

Weird, because Anvil generates that line with the correct base class for the form. Perhaps you edited it?

Try to create a new form and see what the correct working code looks like.

Thanks so much for your assistance, I was able to fix it

But it shows another error now

  • [An internal error has occurred] - see browser console for more details
  • @https://xdeag7d5dqu3hg3a.anvil.app/debug/Y56I6XFUY26APNSLQVNZJDLKKGRE6FPS%3DWESMPSCGDBADJ42IMNA54XLT/_/static/runtime/js/lib/plotly-latest.min.js?buildTime=1701944471703:8:379850 @https://xdeag7d5dqu3hg3a.anvil.app/debug/Y56I6XFUY26APNSLQVNZJDLKKGRE6FPS%3DWESMPSCGDBADJ42IMNA54XLT/_/static/runtime/js/lib/plotly-latest.min.js?buildTime=1701944471703:8:416345 @https://xdeag7d5dqu3hg3a.anvil.app/debug/Y56I6XFUY26APNSLQVNZJDLKKGRE6FPS%3DWESMPSCGDBADJ42IMNA54XLT/_/static/runtime/dist/runner2.bundle.js?sha=474e8e95b3c4df504f75:519:3517 @[native code] promiseReactionJob@[native code]

I published the app to check again, it says unhandled runtime error

Here’s the app link

The client server code:


# form_code.py
from ._anvil_designer import Form1Template
from anvil import Plot, server

class Form1(Form1Template):
    def __init__(self, **properties):
        self.init_components(**properties)
        self.custom_plot = Plot()
        self.custom_plot.visible = False
        self.add_component(self.custom_plot, slot="plot")

    def button_plot_click(self, **event_args):
        list_a = [float(val.strip()) for val in self.text_box_a.text.split(",")]
        list_b = [float(val.strip()) for val in self.text_box_b.text.split(",")]

        # Use anvil.server.call to call the server function
        plot_data = server.call("generate_plot", list_a, list_b)

        # Call the display_plot method with the received plot data
        self.display_plot(plot_data)

    def display_plot(self, plot):
        self.custom_plot.visible = True
        self.custom_plot.data = plot

    def text_box_a_change(self, **event_args):
        self.custom_plot.visible = False

    def text_box_b_change(self, **event_args):
        self.custom_plot.visible = False

Server module


# server_module.py
import anvil.server
import plotly.express as px

@anvil.server.callable
def generate_plot(list_a, list_b):
    # Ensure that list_a and list_b are lists of numbers
    try:
        list_a = [float(x) for x in list_a]
        list_b = [float(x) for x in list_b]
    except ValueError:
        raise ValueError("Lists should contain only numeric values")

    # Create a plot using Plotly Express
    fig = px.scatter(x=list_a, y=list_b, labels={'x': 'List A', 'y': 'List B'})
    
    # Return the Plotly figure as JSON
    return fig.to_json()

I appreciate your assistance, thanks :open_hands:t3:

you should find these docs helpful
returning the figure and setting the .figure on the Plot is what you want

Note: The link you provided above is a link to the live app rather than a clone link. It’s more useful for the community to get a clone link to the app, that way the community can take a look at the source code and make changes themselves, before suggesting solutions.