This might sound funny but i am new to python
What I’m trying to do is to download a pdf form that has 2 datagrids and a plot
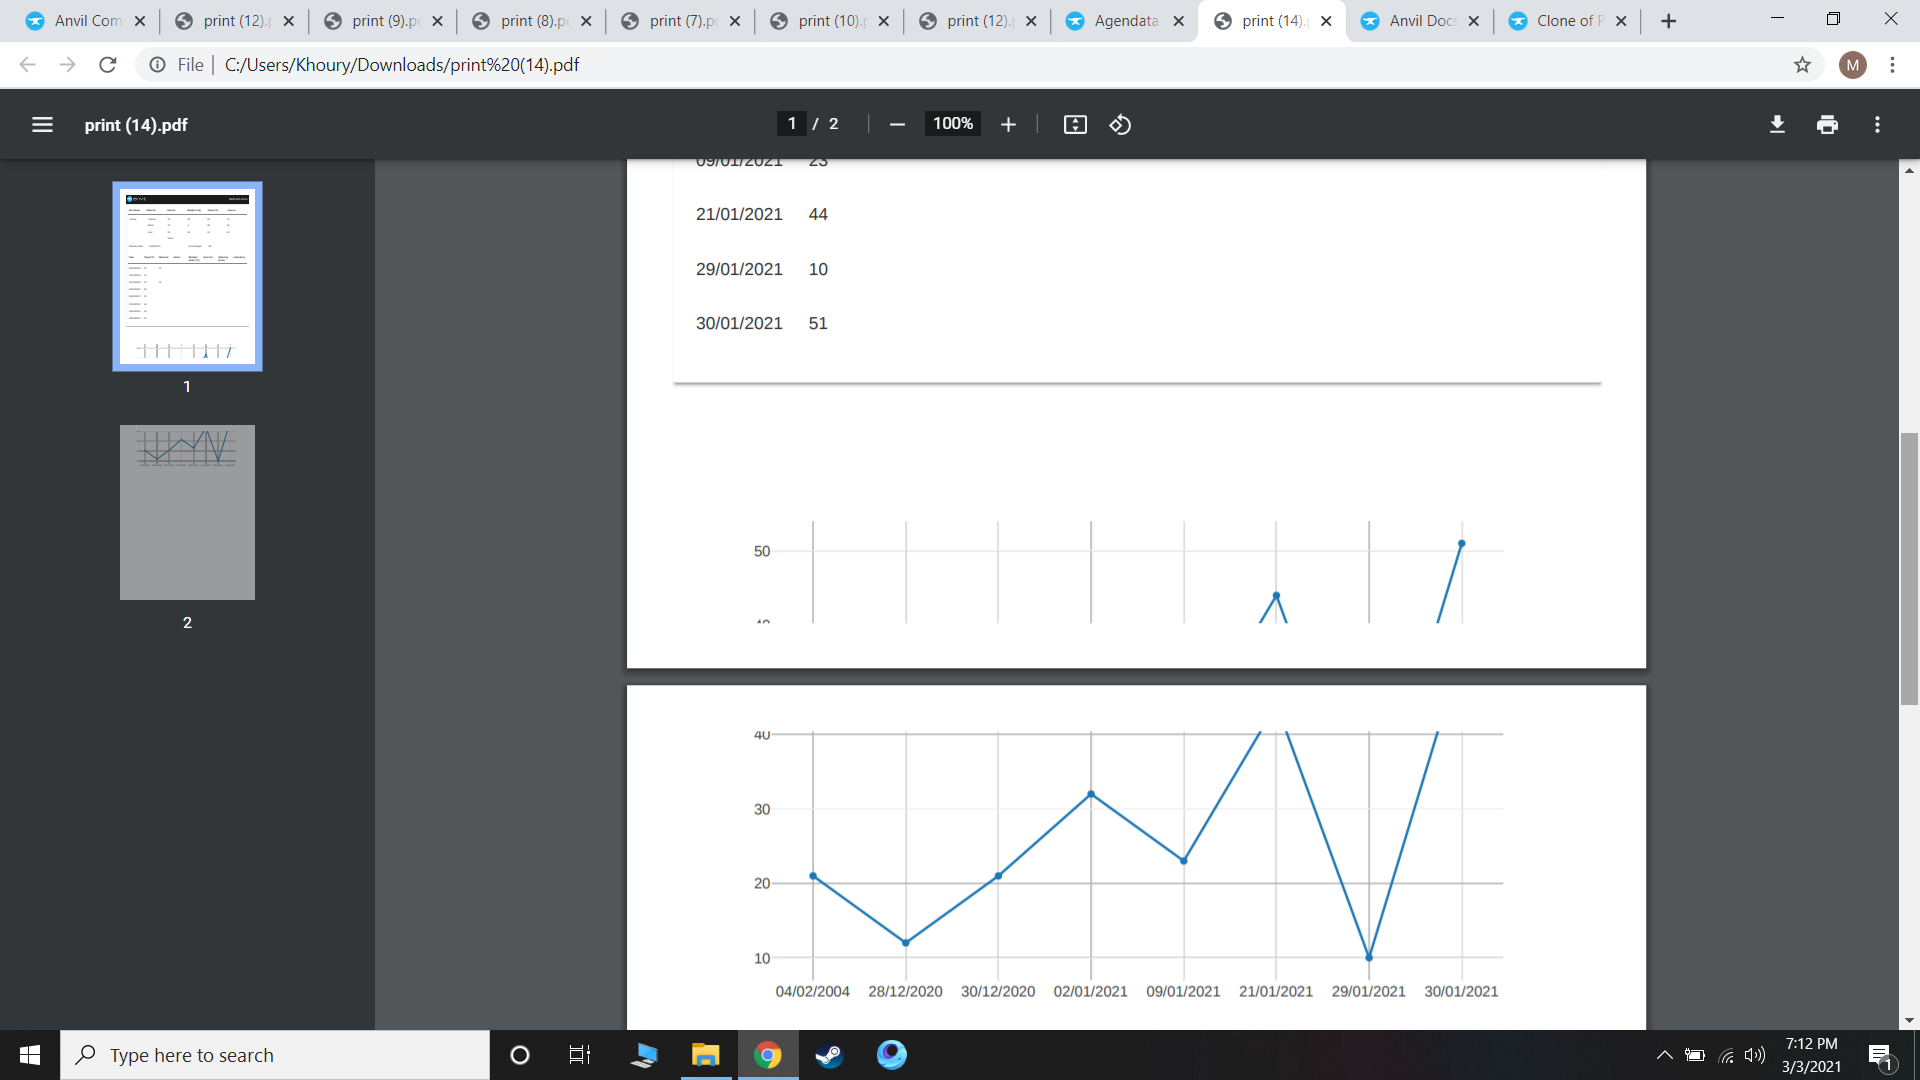
The problem is that at some point the plot is divided between two pages as seen in the image
I just need to know how to make the plot element of the pdf to be on a page on its own or if there is an other solution you could suggest i would really appreciate it.
Code Sample:
@anvil.server.callable
  def create_pdf(dg_1, dg_2, plot):
  pdf = anvil.pdf.render_form('Form1', dg_1, dg_2, plot)
  return pdf()

IN FORM: all is working perfectly . the download button and the init for the pdf  /form thing are on point no problem there
Everyone helping on here is doing so voluntarily in their own time. If nobody is answering, it’s because they don’t know the answer or don’t have time to look into it.
If you need help urgently, I suggest you consider paying for a support plan.
Check out the app in the solution post, you should be able to us that for your problem.
Essentially create a custom component which includes a page break.
Add this to the form you want to print just above your plot.
It will show a horizontal line in the design view.
But it shouldn’t be there when you print.
Hmm. I added this to my component and it didn’t work as expected. I’m not seeing those page breaks where I’m dropping that custom component. Any idea what I’m missing here?
You may need to adjust the margin-top property. -55px worked for me.
If you’re debugging removing the border: none will help to see what’s going on when you print.