What I’m trying to do: I just posted the same question here:
https://stackoverflow.com/questions/72832922/anvil-works-plotly-header-not-populating-in-plotly-table
What I’ve tried and what’s not working:
Code Sample:
import plotly.graph_objects as go
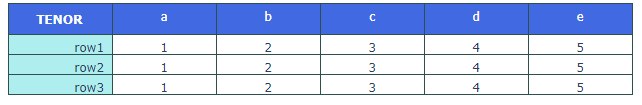
data = [go.Table(
header = dict(
values = ['<b>'+'TENOR'+'</b>'] + list(['a','b','c','d','e']),
line_color = 'darkslategray',
fill_color = 'royalblue',
align = 'center',
font = dict(color = 'white', size = 12),
height = 20
),
cells = dict(
values = [['row1','row2','row3'],[1,1,1],[2,2,2],[3,3,3],[4,4,4],[5,5,5]],
line_color = 'darkslategray',
fill = dict(color=['paleturquoise', 'white']),
align = ['right', 'center'],
font_size = 12,
height = 20)
)]
fig = go.Figure(data = data)
fig.show()
When I try the same code in Anvil’s editor though, the table that shows is:
b = Plot()
b.data = data  # same data variable as above
self.card_4.add_component(b)
and it shows without a header (just a blank one)
Clone link:
share a copy of your app