Hey all,
I am currently trying to figure out how to better fit a plotly plot into a small card, without having lots of empty space around it.
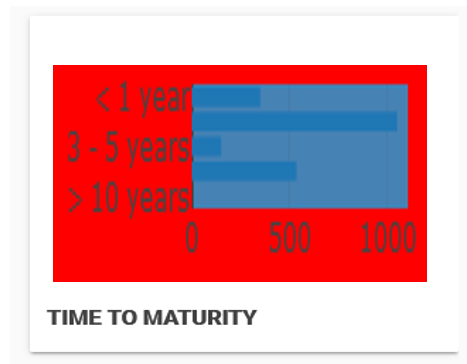
This is what I currently have, with the paper colored in red and the plot background in blue for clarity:
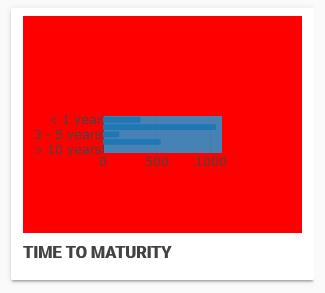
What I want is to reduce the size of the red paper background to get the plot itself to fill out most of the panel.
The plot code:
def update_plot_maturity_times_3(self):
values, labels = anvil.server.call(‘calculate_mortgage_times_to_maturity’)
  trace0 = go.Bar(x=list(reversed(values)),y=list(reversed(labels)),orientation='h')

  self.plot_time_to_maturity.data = [trace0]
  self.plot_time_to_maturity.layout.barmode = 'relative'
  self.plot_time_to_maturity.layout.hovermode = 'closest'
  self.plot_time_to_maturity.config = dict(displayModeBar = False)
  self.plot_time_to_maturity.layout.plot_bgcolor = "steelblue"
  self.plot_time_to_maturity.layout.paper_bgcolor = "red"
Thank you all for your help!
Cheers!