Introducing Profiling and Tracing in Anvil
When diagnosing performance issues, you need to understand what’s actually happening in your code. Anvil’s new profiling and tracing tools provide detailed visibility into what your app is doing and where time is being spent, allowing you to find bottlenecks and optimise your code.
Gain insights with profiling
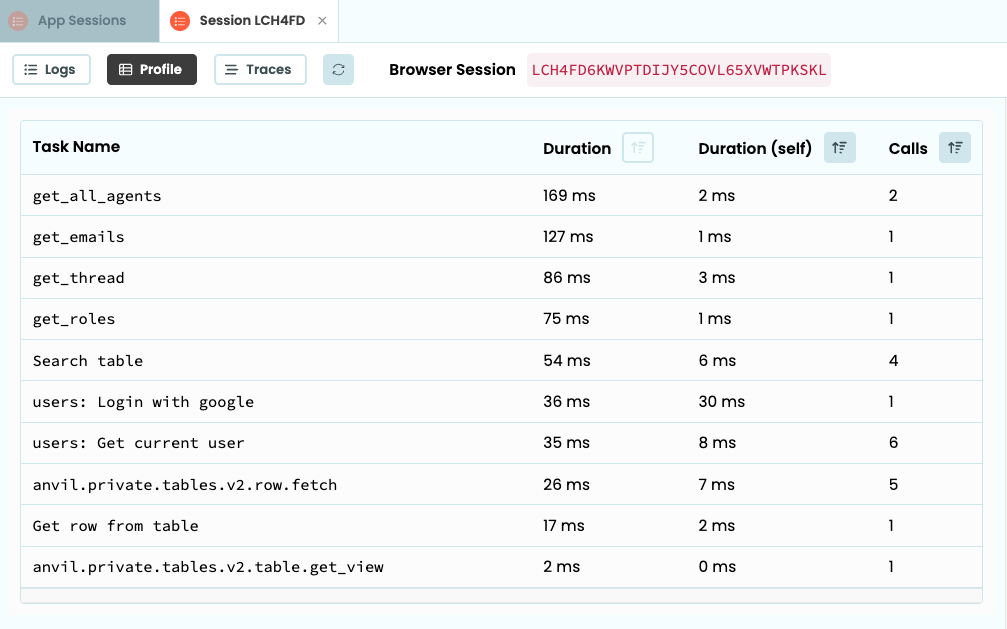
Profiling gives you an overview of all the different tasks your app ran, including how many times each task was called and the total duration across calls.
End-to-end visibility with tracing
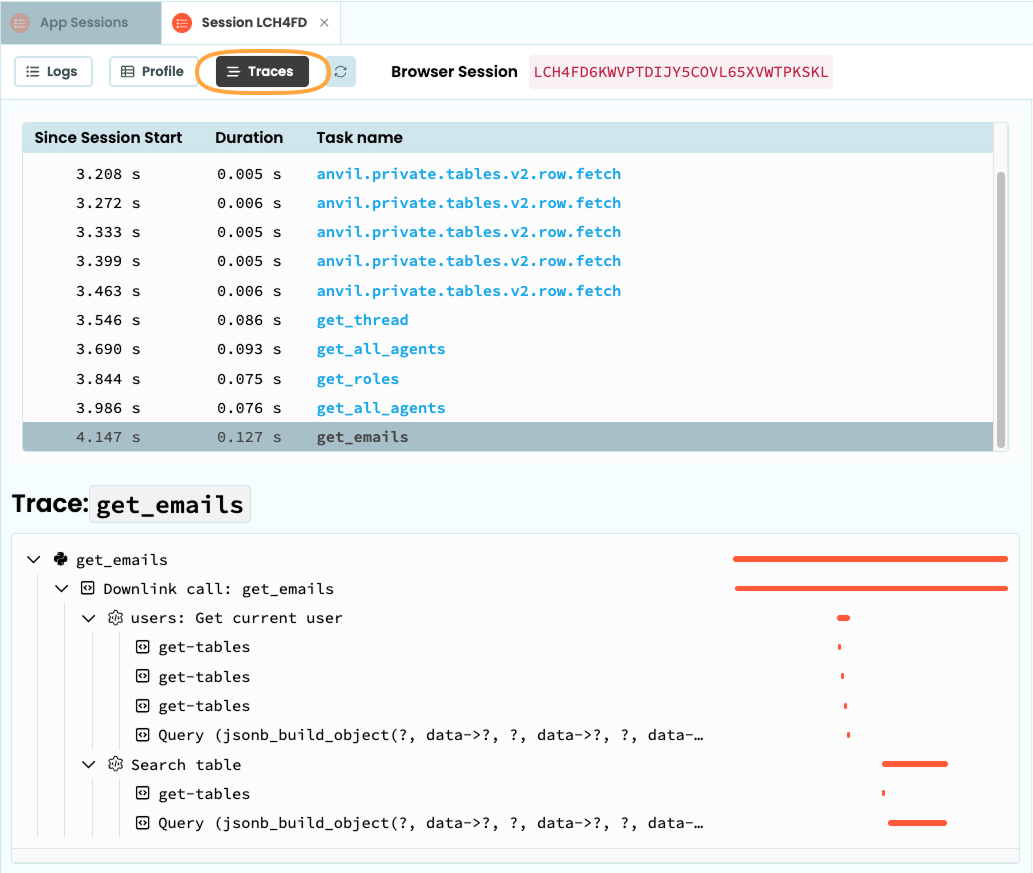
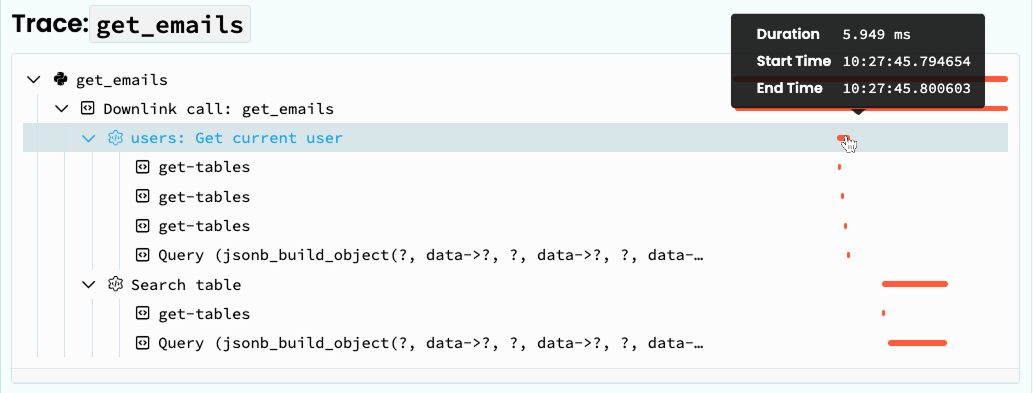
Tracing shows you the journey of each of your app’s tasks, including any subtasks it called, from start to finish. This allows you to pinpoint slowdowns in your app so you can make your app more efficient.
How to get started
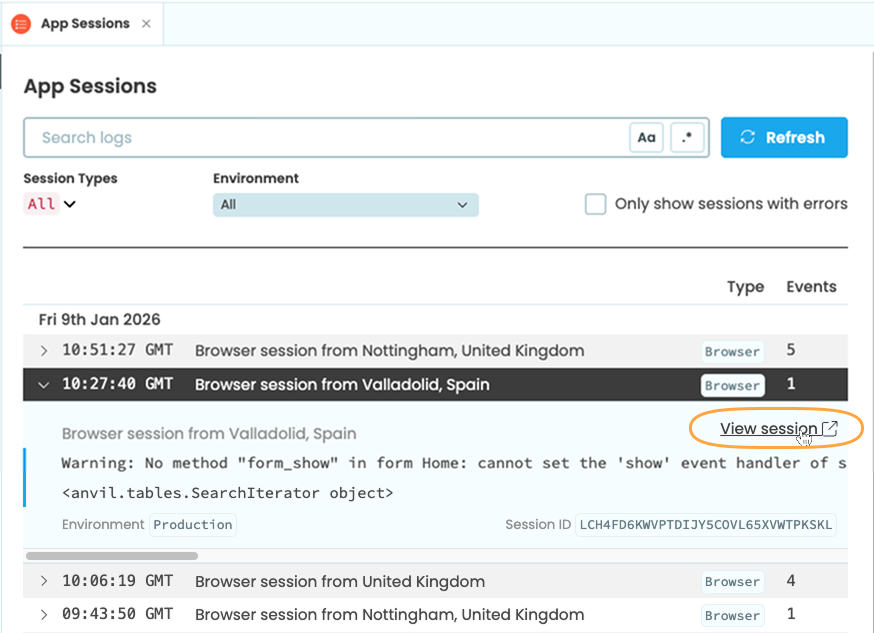
Anvil’s profiling and tracing tools are available on the Business Plan and above. To get started, go to App Sessions, choose a session and click “View Session”. From here, you’ll find the Profile and Traces tabs where you can dig into your app’s performance. Find more information in our documentation and announcement blog post.