Hi,
I want to show latex in plotly graph objects axis title. I am able to show latex inside a label, but not in the plot.
I added this code to the native libraries:
<script id="MathJax-script" src="https://cdn.jsdelivr.net/npm/mathjax@3/es5/tex-mml-chtml.js"></script>

<script type="text/javascript">
  window.PlotlyConfig = {MathJaxConfig: 'local'};
</script>:
This code was added to the form:
    def form_show(self, **event_args):
        """This method is called when the HTML panel is shown on the screen"""
        MathJax.typeset()
form_show was also linked to the show event of the form.
Here is the clone link:
An addon to this, when using the MathJax native library the ability to download plots no longer works.
I get the message “Taking snapshot - this may take a few seconds” directly followed by “Sorry there was a problem downloading your snapshot!”
It looks like this has been a problem in the plotly eco system as versions of plotly/mathjax have changed and some solutions out there are outdated.
from the plotly.js README
GitHub - plotly/plotly.js: Open-source JavaScript charting library behind Plotly and Dash
MathJax
You could load either version two or version three of MathJax files, for example:
<script src="https://cdnjs.cloudflare.com/ajax/libs/mathjax/2.7.5/MathJax.js?config=TeX-AMS-MML_SVG.js"></script>
<script src="https://cdn.jsdelivr.net/npm/mathjax@3.2.2/es5/tex-svg.js"></script>
When using MathJax version 3, it is also possible to use chtml output on the other parts of the page in addition to svg output for the plotly graph. Please refer to devtools/test_dashboard/index-mathjax3chtml.html to see an example.
So using the second script above, and changing your native libraries just to use that script, works as expected
and with that script, there seems no need to do anything in form show.
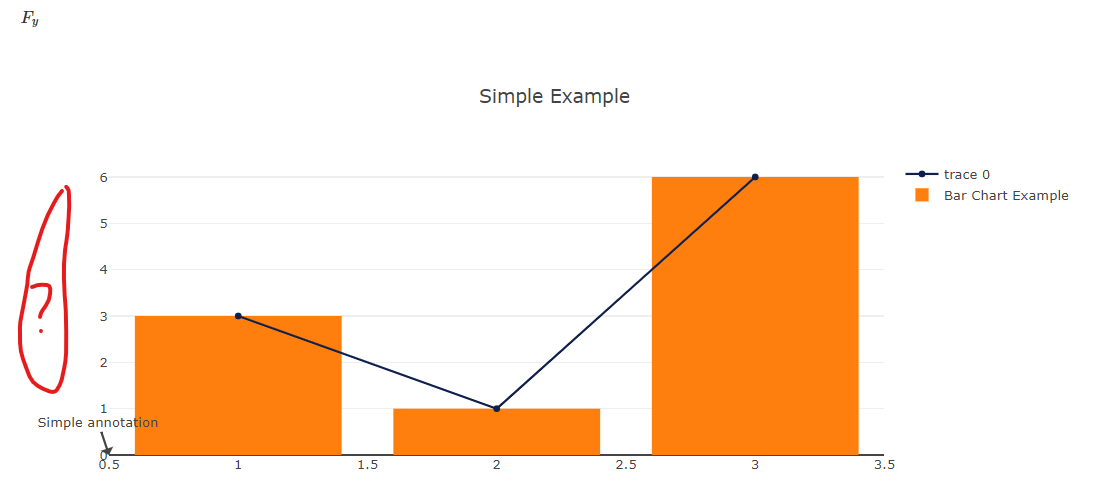
and changing the yaxis title to self.plot_1.layout.yaxis.title = '$F_y$'
1 Like
Thanks this works!
I should learn to read the documentation… 
1 Like