Hi,
Seems like Anvil is having some issues. Running existing code that worked fine two weeks back. Should draw Plotly gauges. Today it is displaying graphs: -
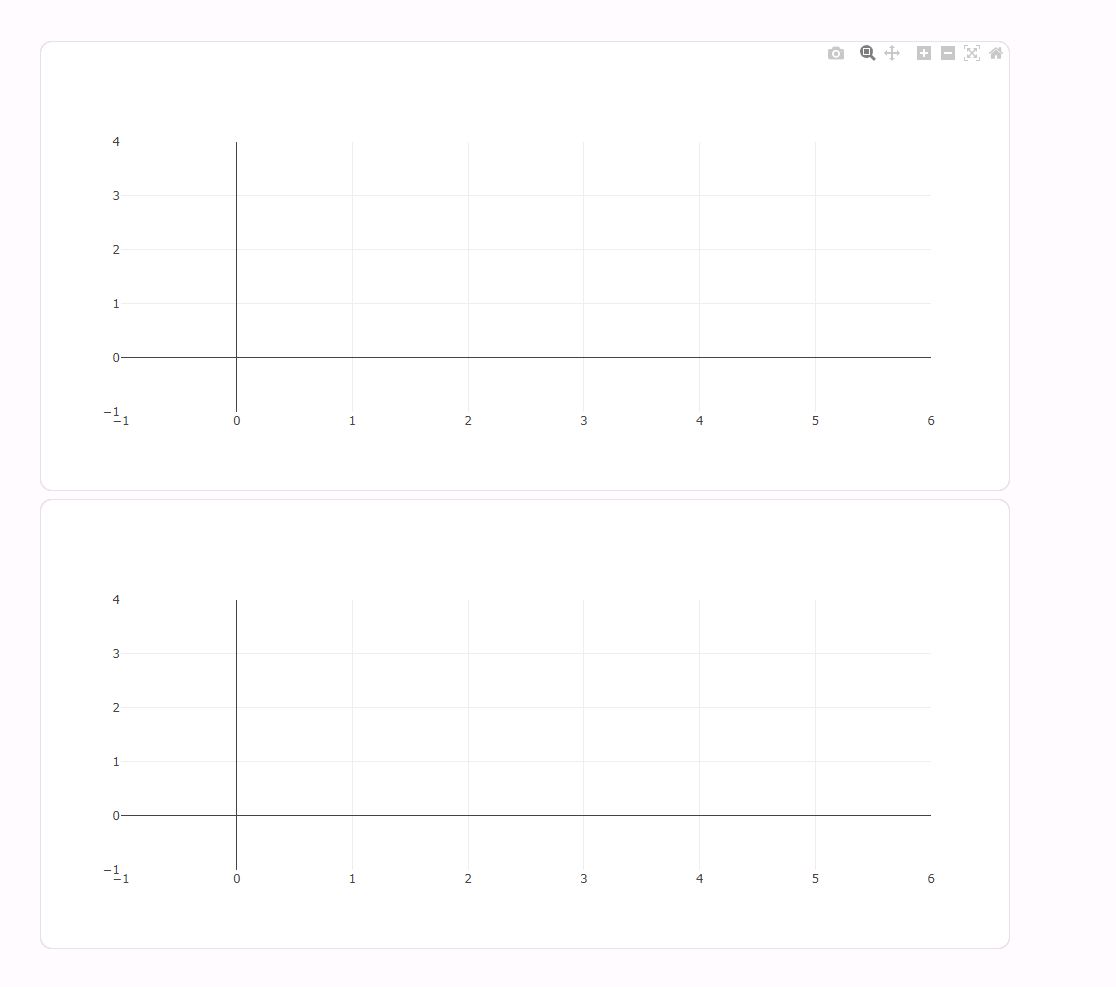
It is happening to all my projects using Plotly gauges
Code Sample:
  #lets build the form plots
  flo_grade = lis_dic_updated_kpis[0][str_return_list_key]
  write_log_msg(str_func_name=update_kpi_elements.__name__, str_state='executing', str_type='DEBUG', str_message=f'flo_grade=({flo_grade}), lis_dic_updated_kpis[0][\'flo_grade\']=({lis_dic_updated_kpis[0][\'flo_grade\']})')
  obj_gauge = plotly_graph.Figure(plotly_graph.Indicator(mode="gauge+number",
                                                         value=flo_grade,
                                                         gauge={'axis': {'range': [None, 100]},
                                                                'bar': {'color': "black"},
                                                                'steps': [{'range': [0, 30], 'color': "red"}, {'range': [80, 100], 'color': "gold"}],
                                                                'threshold': {'line': {'color': "black", 'width': 4},
                                                                'thickness': 0.75,
                                                                'value': flo_grade}},
                                                          domain={
                                                                'x': [0, 0],
                                                                'y': [0, 0]},
                                                          title={'text': 'Grade Latest'}))
  obj_kpis_form.plot_HaiderLatest.data = obj_gauge

  flo_grade_faz = 0
  flo_grade_faz = lis_dic_updated_kpis[1][str_return_list_key]

  obj_gauge_faz = plotly_graph.Figure(plotly_graph.Indicator(mode="gauge+number",
                                                         value=flo_grade_faz,
                                                         gauge={'axis': {'range': [None, 100]},
                                                                'bar': {'color': "black"},
                                                                'steps': [{'range': [0, 30], 'color': "red"}, {'range': [80, 100], 'color': "gold"}],
                                                                'threshold': {'line': {'color': "black", 'width': 4},
                                                                'thickness': 0.75,
                                                                'value': flo_grade_faz}},
                                                          domain={
                                                                'x': [0, 0],
                                                                'y': [0, 0]},
                                                          title={'text': 'Faz Grade Latest'}))
  with anvil.server.no_loading_indicator:
     obj_kpis_form.plot_FazLatest.data = obj_gauge_faz
  write_log_msg(str_func_name=update_kpi_elements.__name__, str_state='exit')
**Clone link:  https://anvil.works/build#clone:YOB7ZZ3VEBWCZ3YY=WGH5GOI7Q3UUBHHSBKGKECZ7**

Published to
https://extraneous-flat-dimetrodon.anvil.app


Thanks
Haider