Hi,
Once you start having problems in your code (client or server), how do you debug your application withouth having to manually print messages?
How do you get a full trace of errros when they happen? in order to get to the root cause of the problems.
Does it work the same when running your application in the hosted environment or in the opensource server?
Thank you!!
Warm regards
Ricardo
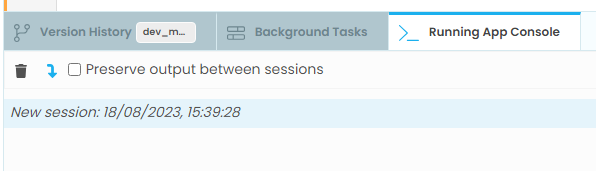
Error messages, including standard Python tracebacks, appear in this IDE window:
and in your App system logs (accessible via this button):

Anything your code print()s also appears in these places.
See The Anvil Editor.
I have no experience with the open-source server. Perhaps someone else can answer that part.
1 Like
@p.colbert
Thank you very much for your answer!!
I’ll leave the question open, in case some has some experience with the opensource server an can add information on that.
On the client side printing is the only way.
On the server side I use PyCharm.
For apps with some serious logic, about half of them, I use test driven development, as decribed here: [Wiki] Best practices: Test-driven development with Anvil
I clone all the apps so I can apply the same theme: What's the workflow I'd need to follow in upgrading an app to MD3? - #2 by stefano.menci
Since all apps are cloned to my computer, even the simple ones that don’t need test driven development, I use PyCharm to do some testing and debugging locally: Using PyCharm for development and testing
In some cases, when development is done and the app is in production, I send myself an email that includes the traceback: How to handle unexpected disconnect in Uplink program? - #4 by stefano.menci
1 Like
@stefano.menci
Thank you very much!!
I think with all that information I have a lot to check and study to define a process for doing this.