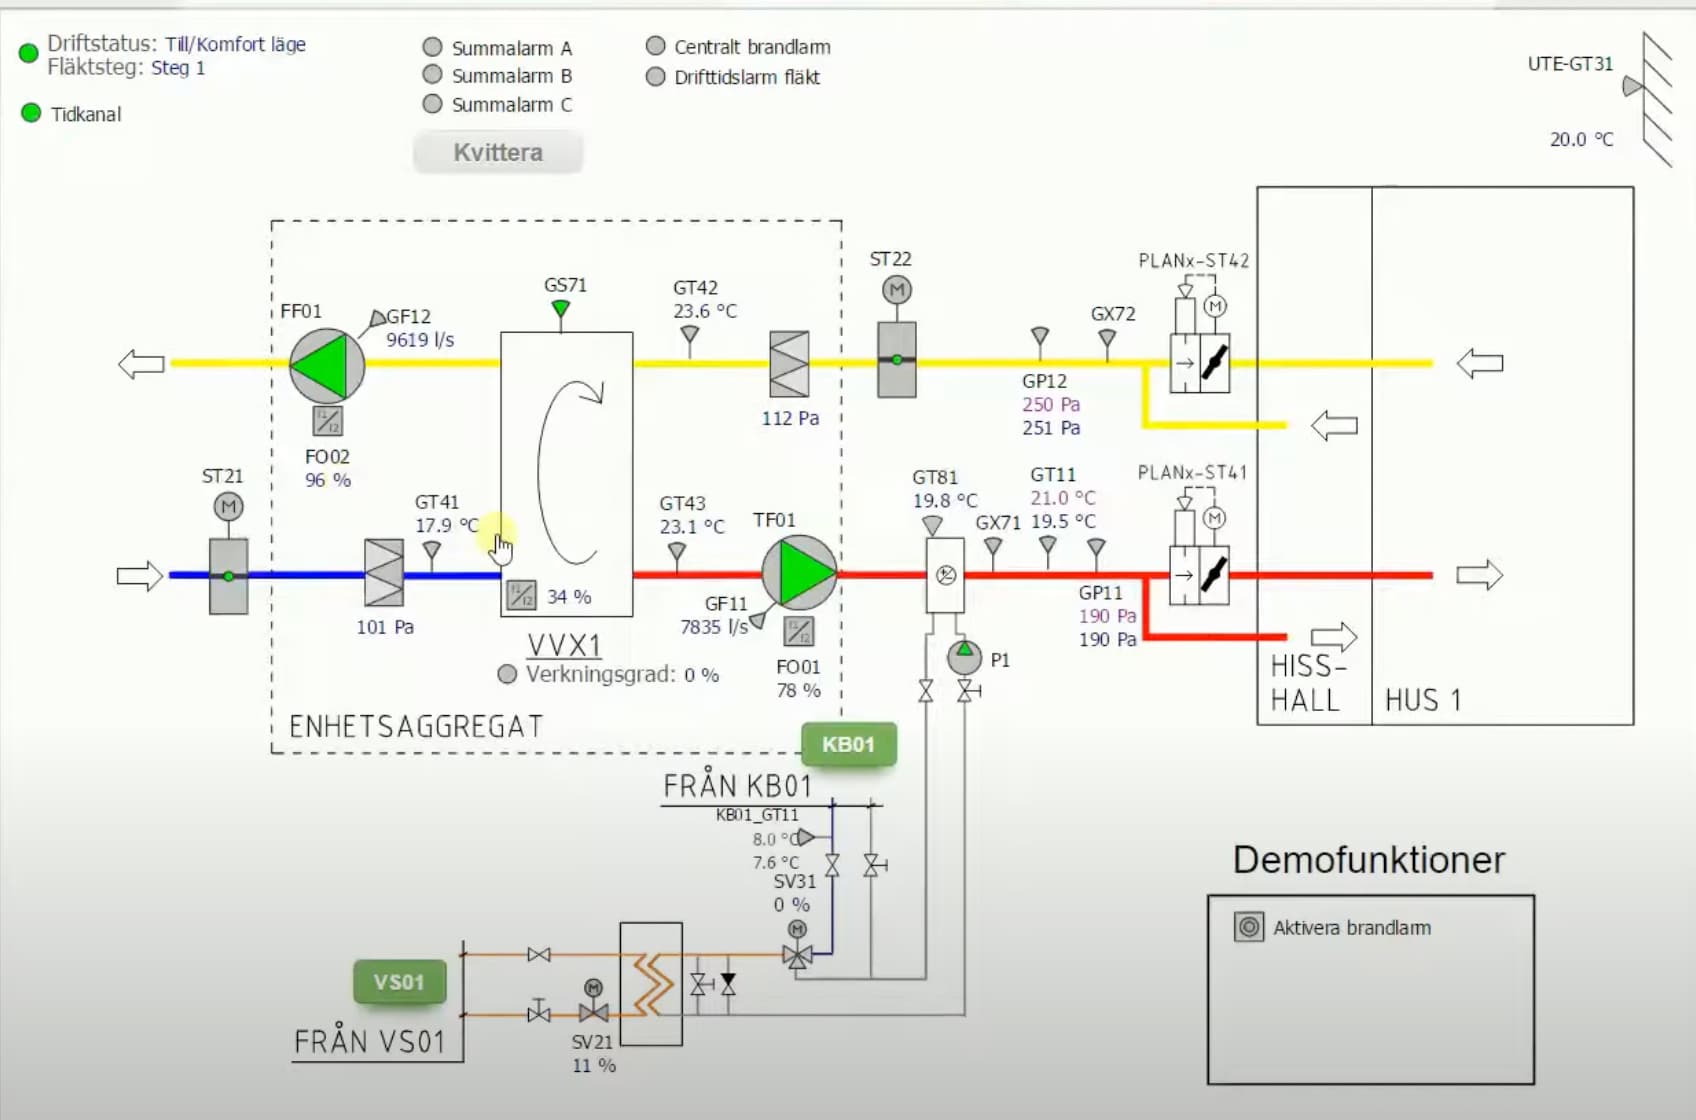
Im working with a small “smart city”/HVAC project and i would like to create a page which looks like the image below.
A little more context of the image. The image below is created in a “hvac software”, in where you can drag and drop svg symbols (shown in the picture below) on to a canvas. The canvas have a fixed (absolute position) e.g. the canvas is not responsive. But since the “hvac software” that I normally use lacks ease of use, lacks web functionality and does not use python, my eyes turns to Anvil
I have been playing around with the xy-panel container and the canvas object. There are yellow, blue and red lines, which for my understanding suites best in a canvas.
The symbols, which is places on top of the yellow, blue and red lines, suites best as image components within the xy-panel. Since the symbols should be “interactive” e.g. they should change color on events, I managed to change the source of the image component. I dont know if this is the “right” way to do it.
Sadly I do not seem to get the hang of it.
Based on this information - do you have any recommendations or tips to help me come further? Any example projects would be much appreciated!!