Hello, it seems that the layout.uniformtext attribute does not affect the the appearance of a figure in Anvil.
What I’m trying to do:
I’m trying to create a bar chart with text displayed at the center of each bar. However, if the bar is too small for the text to fit, I want to hide it. I have it working in a jupyter notebook using Plotly version 5.19, however, the same code does not produce the expected behavior in an Anvil app.
Jupyter notebook code and output:
import plotly.graph_objects as go

score_keys = ['1', '2', '3', '4', '5', '6', '7', '8', '9', '10']
hours_watched = [0.0, 2.11, 1.9, 8.86, 13.04, 10.49, 55.57, 381.2, 100.89, 52.47]

fig = go.Figure(data = go.Bar(y=score_keys,
                              x=hours_watched,
                              orientation='h',
                              text=hours_watched,
                              textposition = 'inside',
                              insidetextanchor = 'middle',
                              textangle= 0))

fig.layout = {
    'xaxis': {'showticklabels': True, 'title': 'Hours watched'},
    'yaxis': {'title': 'Score'},
    'template': 'plotly_dark',
    'uniformtext_minsize': 12,
    'uniformtext_mode': 'hide',
}

fig.show()
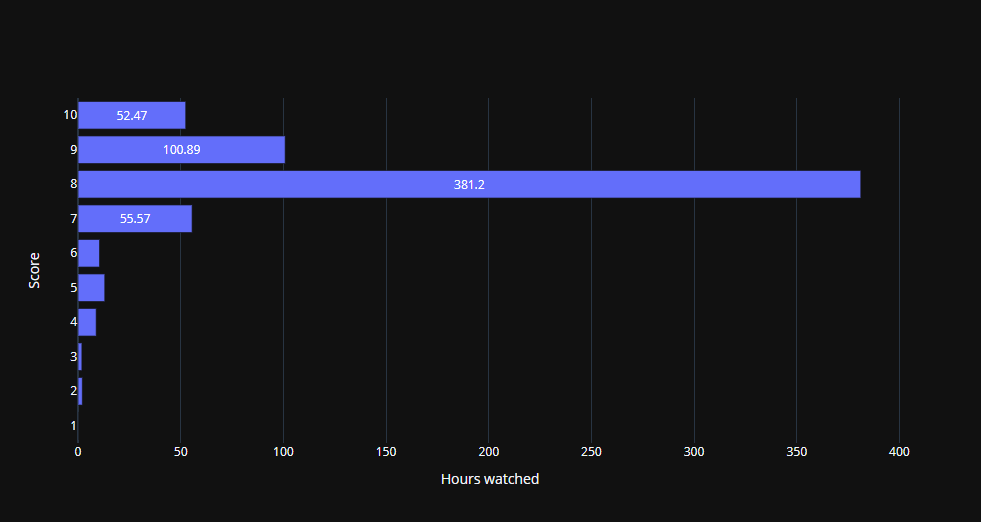
As can be seen, the bars for labels 2 to 6 are too small to display the text and it is hidden. This behaviour was defined by setting the ‘uniformtext_minsize’ to 12 and ‘uniformtext_mode’ to ‘hide’.
However, in an Anvil app these parameters do not affect the plot at all.
Anvil code and output:
from ._anvil_designer import temp_formTemplate
import plotly.graph_objects as go

class temp_form(temp_formTemplate):
  def __init__(self, **properties):

    # Set Form properties and Data Bindings.
    self.init_components(**properties)

    score_keys = ['1', '2', '3', '4', '5', '6', '7', '8', '9', '10']
    hours_watched = [0.0, 2.11, 1.9, 8.86, 13.04, 10.49, 55.57, 381.2, 100.89, 52.47]

    self.score_distribution_plot.data = go.Bar(y=score_keys,
                                               x=hours_watched,
                                               orientation='h',
                                               text=hours_watched,
                                               textposition = 'inside',
                                               insidetextanchor = 'middle',
                                               textangle= 0)

    self.score_distribution_plot.layout = {
      'xaxis': {'showticklabels': True, 'title': 'Hours watched'},
      'yaxis': {'title': 'Score'},
      'template': 'plotly_dark',
      'uniformtext_minsize': 12,
      'uniformtext_mode': 'hide',
    }
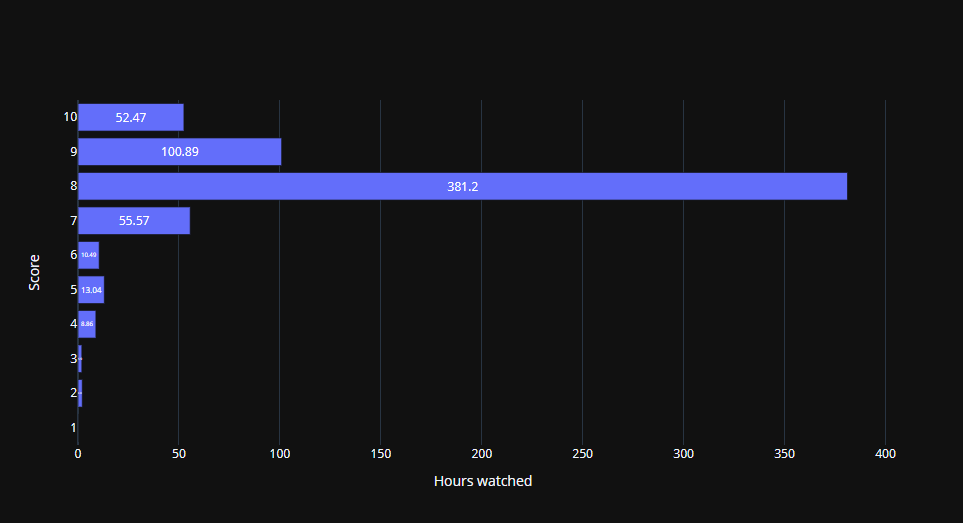
As can be seen, the text is being squished to fit the bars ignoring the uniformtext_minsize and uniformtext_mode parameters.
The layout.uniformtext parameter was added to Plotly in version 4.5.0 - link. It is my understanding that Anvil is already using a higher Plotly version - link.
Are there any workaround to make this work in Anvil?
Thanks,
Zaro