I hit the breakpoint, clicked on the Step Over button 3 times, and the execution frame stepped into Project.__init__, which is defined in its own module.
Is this normal?
I hit the breakpoint, clicked on the Step Over button 3 times, and the execution frame stepped into Project.__init__, which is defined in its own module.
Is this normal?
We’ll take a look. I imagine you’ve identified an edge case in our client side debugger
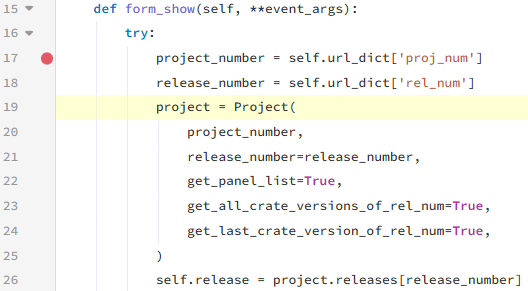
I tried to reproduce based on this code sample
but the minimal example i cobbled together behaved as expected ![]()
I tried to create a minimal example, but the original issue doesn’t reproduce. Instead, I ran into a different problem:
When setting a breakpoint on line PanelDetails:17 and stepping over, execution correctly steps over the line that creates Project, but then silently runs the next line (PanelDetails:26), which crashes, before stopping at the first line of the except block (PanelDetails:28).
The behavior is consistent across breakpoints:
PanelDetails:26 → ignoredPanelDetails:28 → worksHere’s the clone link for the minimal example: Anvil | Login
It’s hard to reproduce the original issue in a minimal app. The full version involves many dependencies (Anvil Extras, multiple apps, routing, dynamic imports, form loading into a container column panel, etc.).
You can take a look at this example to see if you can spot anything to fix. If you find something, I can test it in the full app to confirm whether it resolves the issue.
Alternatively, I can create a test user in the production app so you can debug it directly there.
That’s because the error is name 'Releases' is not defined
NameError: name 'Releases' is not defined
at Release, line 166
called from PanelDetails, line 19
Oh, it’s Releases not defined, not releases!!
I thought the error was in the following line, when accessing project.releases, not inside the __init__, when accessing Releases.
Well, then this minimal example is useless.
I will send you the credentials so you can access the production app.
It’s the timer tick you’ve got on your main form that’s causing the issue.
If after the first breakpoint i do
get_open_form().check_if_modified.interval = 0
# in the debug console
then step over works again
we’ll see what we can do
Hi Stu,
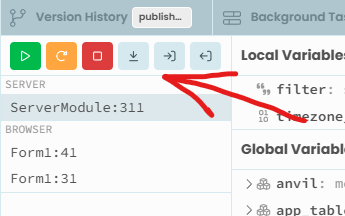
Now that you mention timers in the debugger, here’s a feature I’ve dreamed of ever since using timers as poor man’s multithreading back in the VB3 / VB6 days.
I’d love to have a dropdown here (see screenshot) showing the list of active frames.
Here’s how it could work: when a breakpoint is hit, the debugger behaves as it does now, showing local variables for the paused frame. But if a timer tick fires while the debugger is paused, its execution should automatically stop on the first line (as if there were an implicit breakpoint). The dropdown would then appear, listing both frames Main and my_timer_tick.
From there, the user could select a frame to inspect its variables or use the interactive console, and either step through it or resume it. There would be two resume buttons: one to continue just the current frame, and another to resume all frames and the scheduler.
Anvil timers aren’t true parallel threads, so I’m not sure if it’s possible to arbitrarily step through any frame. But the core idea would be for the debugger to pause new scheduled code and automatically break on entry for any tick event (or other scheduled callback) while the debugger is active, adding it to the dropdown instead of running it immediately.
We can always dream.
currently if a timer fires off some python code while the debugger is paused, we don’t execute that python code until the debugger resumes.
So we do know about the timer tick frame in some sense.
I can imagine things getting pretty hairy with timers with small intervals.
Yeah… can’t blame me for trying! ![]()
At runtime a tick event doesn’t start if the previous scheduled execution is still running, right?
Keeping the same behavior would just mean one entry per timer in the dropdown.
yes - good point!
(plus some more characters)