What I’m trying to do:
Draw a graph (by matplotlib.pyplot.plot) and input it to Anvil Client side
(it draws fine as desired in my local PC )
What I’ve tried and what’s not working:
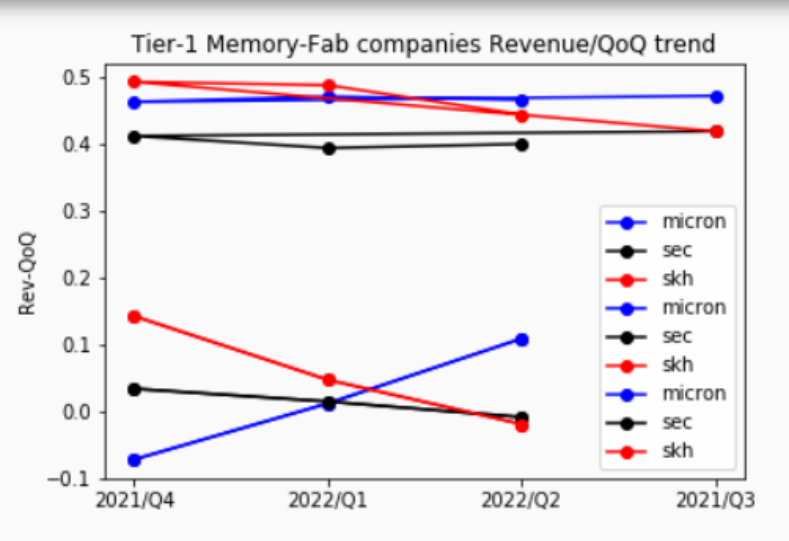
the same code in anvil.server_uplink side. and using ‘anvil.mpl_util.plot_image()’ to display in anvil_client side, but it draws multiple lines and labels which are unwanted, and some line clashed altogether and too many repeated labels
(more weird is, sometimes it displays ok, sometimes it looks bad, not everytime shows the same (bad) result)
Code Sample:
(in Server_uplink side)
@anvil.server.callable
import pandas as pd
import matplotlib.pyplot as plt

df=pd.read_excel("my_local_excel_file).xlsx")
piv=pd.pivot_table(data=df,index='yr_mo',columns='company',values='qoq')
tbl=piv
df22=pd.DataFrame(tbl)

x=df22.index
y1=df22.micron
y2=df22.sec
y3=df22.skh
plt.title('Tier-1 Memory-Fab companies Revenue/QoQ trend')
plt.ylabel('Rev-QoQ')

plt.plot(x,y1, marker='o', color='b')  #micron
plt.plot(x,y2, marker='o', color='k')  #sec
plt.plot(x,y3, marker='o',color='r')  #skh
plt.legend()

return anvil.mpl_util.plot_image()

# (in Client side)
...
result_graph=anvil.server.call('func_name')
self.image_3.source=result_graph
Clone link:
share a copy of your app
In cases like this, you’ll want to see exactly what the data actually looks like, as received by matplotlib (i.e., after all the data transformations such as pivot_table), as opposed to what you were expecting it to look like. I’m fairly sure that the two are significantly different.
So, you might print(x) (and y1, y2, y3) to see what’s actually there.
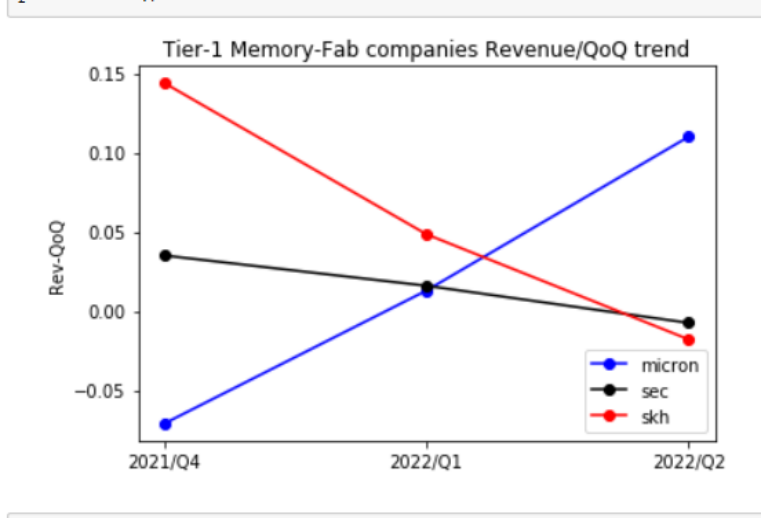
The graph is expected to look like as attached picture below:
that means, the bottom-half lines and one set of label (which contains 3 companies’ line) are the correct one, but I don’t know why it draws the top-half lines and the labels were duplicated twice as well
Neither do I. Which is why I suggested that
so you can see what data you’re actually feeding to the plotter.
You may have heard the old adage, “garbage in, garbage out”. In this case, you seem to be getting 3 data sets instead of one. That should be reflected in the values that you will be printing.
(1) I tried to add 'print(x,y1,y2,y3) inside the code, but there’s no any output shown
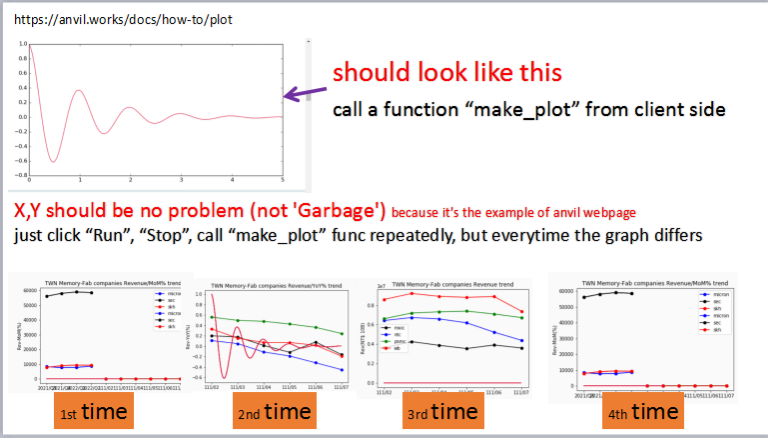
(2) I’m pretty sure it’s not “Garbage in Garbage out” problem, because I just use your matplotlib-example code ( Anvil Docs | Making plots ) as an anvil_server_callable function in uplink-server side , (x,y) is clearly defined in the code:
@anvil.server.callable
def make_plot():
x = np.arange(0.0, 5.0, 0.02)
y = np.exp(-x) * np.cos(2np.pix)
plt.figure(1, figsize=(10,5))
plt.plot(x, y, ‘crimson’)
#print(x)
#print(y) #not shown anything in ‘output’ column
return anvil.mpl_util.plot_image()
I just repeatedly press “Run”->call func ‘make_plot’ in web-app → ‘Stop’ → ‘Run’ again… but everytime it shows the different graphs…
the ‘make_plot’ func-code is simple, it should not show the other function’s data and lines/label if I don’t call them, I only call 'make_plot’function only…
There should be, if you’re looking in the right place. E.g. , if you’re using the Beta editor:
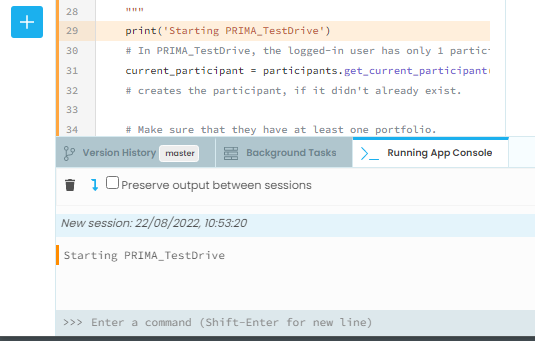
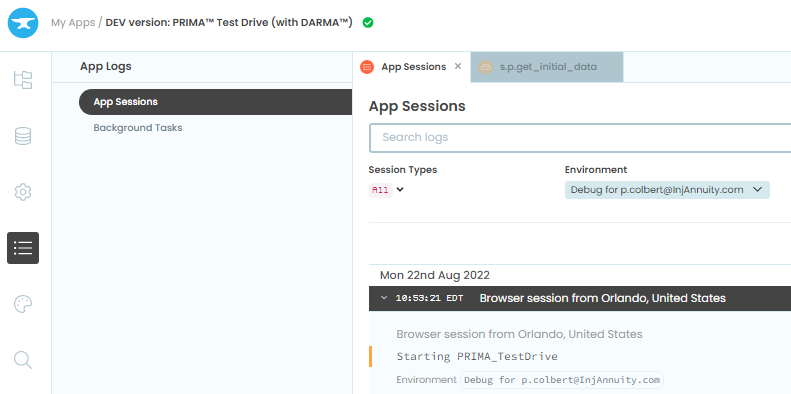
The printed text is also retained in your Application Logs:
These messages are retained, so that you can look back over prior runs to see what has printed out in the past. You should be able to find your
print results there.
I use “beta editor version” and try it again;
In “Running App Console”, only the ‘print’-code in Client side is effective;
e.g:
(client side)
elif sel_num==‘mp’:
media_obj = anvil.server.call(‘make_plot’)
self.image_1.source = media_obj
print(‘making plot’) —> can be shown in console
print (x, y) —> error 'cause x,y undefined outside of the callable function
(uplink server side)
@anvil.server.callable
def make_plot():
x = np.arange(0.0, 5.0, 0.02)
y = np.exp(-x) * np.cos(2np.pix)
plt.figure(1, figsize=(10,5))
plt.plot(x, y, ‘crimson’)
print(‘plot starts!’) —> not showing in console
print(x) → not showing in console
print(y) → not showing in console
return x,y, anvil.mpl_util.plot_image() → even though trying to return x,y , still cannot be shown on console
Since I need to find out what the matplotlib-plot went wrong with , but it’s still not showing on console if the (x, y) variable is only defined inside the anvil-callable-function;
Neither ( return x,y ); nor ( print (x,y) inside the function ) can help the troubleshooting
Does it show in the App Log? 
Readability hint for your code (in this forum): please put this line above your code:
``` python
and this line after it:
```
This will preserve the indentation that Python (and this Forum’s readers!) will need when reading your code.
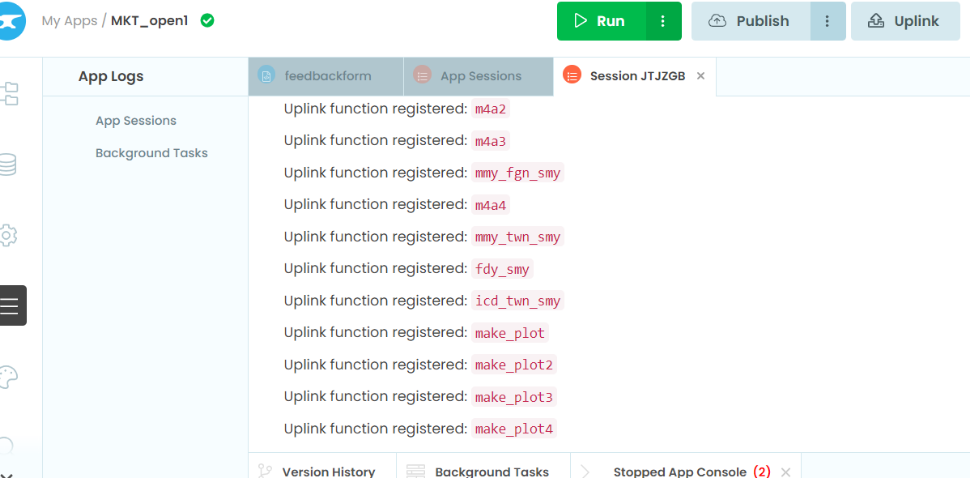
"App log’ just shows the “uplink function registered”, neither indicated anything else, nor showing any printed result even though I put some lines of “print”-command inside
#the remark has been wrapped by ```:
##############################
(client side)
…
elif sel_num==‘mp’:
#select what kind of graph by client via variable(sel_num)
media_obj = anvil.server.call(‘make_plot’)
#call a registered function in uplink-server code
self.image_1.source = media_obj
print(‘making plot’)
can be shown in console
print (x, y)
error 'cause x,y undefined outside of the callable function
(uplink server side)
@anvil.server.callable
def make_plot():
x = np.arange(0.0, 5.0, 0.02)
y = np.exp(-x) * np.cos(2np.pix)
plt.figure(1, figsize=(10,5))
plt.plot(x, y, ‘crimson’)
print(‘plot starts!’)
not showing in console
print(x)
not showing in console
print(y)
not showing in console
return x,y, anvil.mpl_util.plot_image()
even though trying to return x,y , still cannot be shown on console