How it works
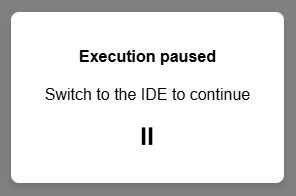
Place a breakpoint on a line and execute the app in a separate tab. When the breakpoint is triggered, the app halts without providing any feedback.
Why I don’t like it
This issue is particularly problematic when launching in a new tab using the ‘Run in new tab’ button, which opens the new tab while concealing the IDE tab. If the breakpoint is set on the form_show, the tab opens, but nothing happens.
How it should work
When the breakpoint is hit, the IDE tab should automatically gain focus. Not only is the running app tab frozen, leaving the user without feedback about the breakpoint being triggered, but the next likely action for the user will involve interacting with one of the debugging buttons.