What
Please add either a Breakpoints window, with the list of breakpoints currently set or a Clear all breakpoints button.
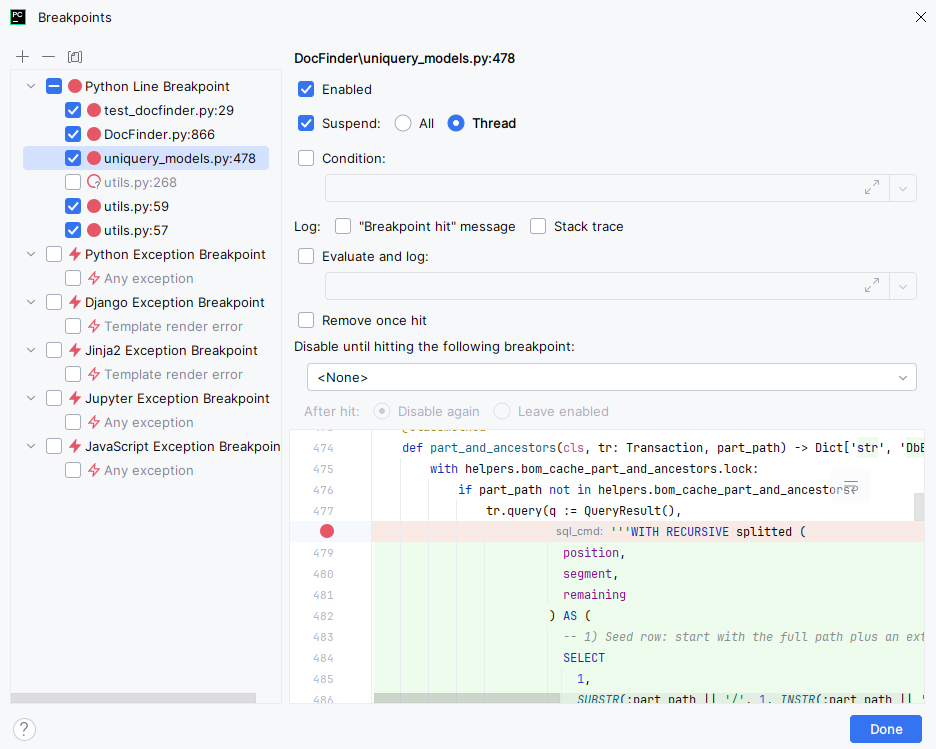
For reference, this is the breakpoint window in PyCharm. Anvil doesn’t need anything that powerful, a simple list that shows where you are currently focused would be great:
Why
I found out (first wasting days of work, then with the help of Anvil staff, thank you!) that running an app in production and in the IDE without breakpoints has the same performances, but running it in the IDE with one (or more) breakpoints can slow down the execution. Even if there is a single breakpoint on a module that is not being used.
The slowdown is usually negligible, but in some cases can be crippling. In my case, I was using fpdf to generate pdf files, which has a function that uses deepcopy, which is heavily affected by breakpoints: printing a 20 pages file would go from 25 seconds to 35 minutes.
The app has dozens of modules for a total of many thousands of lines of code. I had to open them all and scroll down to check if there were forgotten breakpoints, and it wasn’t fun.